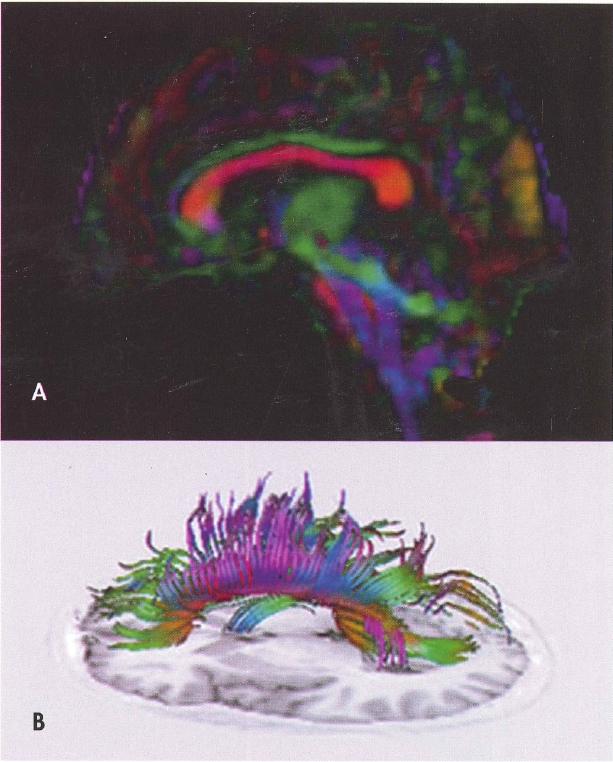

Plate 1. (Figure 4-4) Diffusion tensor imaging (DTI).
A, Fractional anisotropy color map derived from DTI in the sagittal plane. Red indicates white matter fibers coursing in a right-left direction, blue indicates fibers running in a superior-inferior direction, and green reflects fibers oriented in an anterior-posterior direction. B, Fiber tracking using DTI of the total corpus callosum overlaid on a Tl-weighted inversion recovery image from the same brain.
Source. Images courtesy of Elisabeth A. Wilde, Ph.D., Department of Physical Medicine and Rehabilitation, Baylor College of Medicine, Houston, Texas.
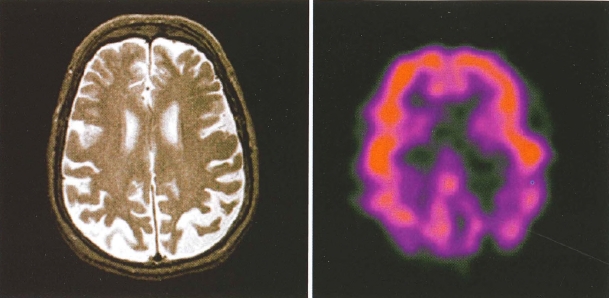
Plate 2. (Figure 4-5) Side-by-side comparison of structural and functional neuroimaging: magnetic resonance imaging (MRI) and positron emission tomography (PET).
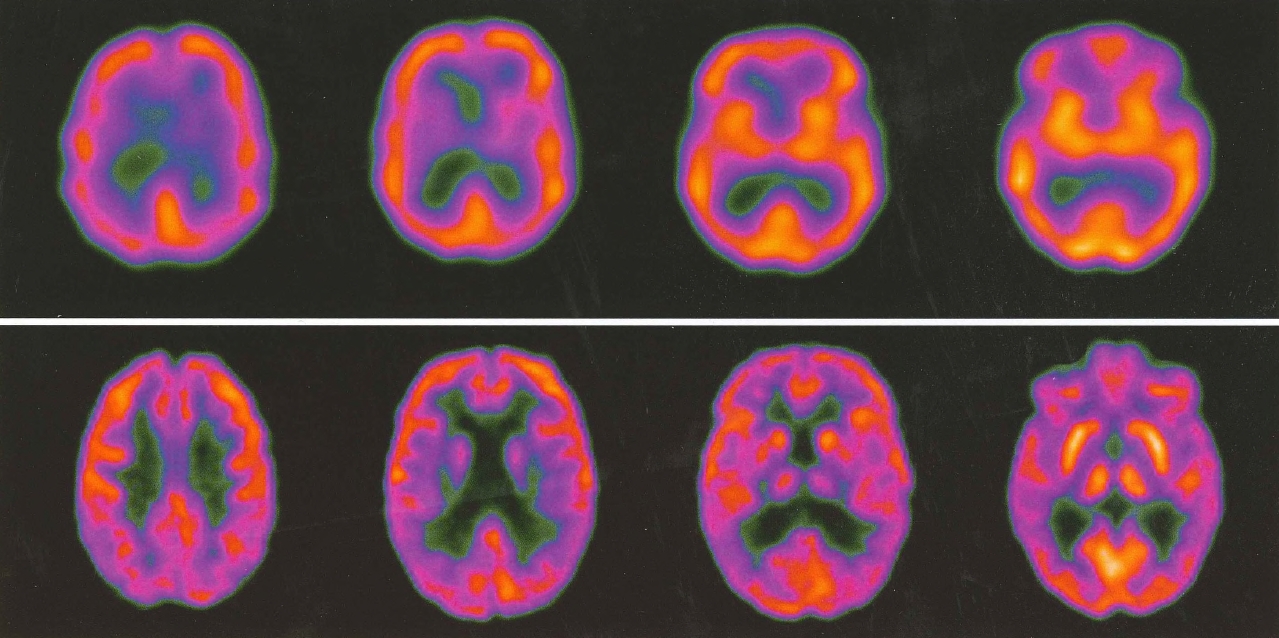
Plate 3. (Figure 4-6) Side-by-side comparison of single-photon emission computed tomography (SPECT) versus positron emission tomography (PET).
SPECT (top row) and PET images from two patients with clinically similar degrees of mild cognitive impairment. The PET scan demonstrates parietal changes, suggesting that this patient is at greater risk of developing Alzheimer's disease. The PET scan also demonstrates much better resolution than the SPECT scan.
Source. Images courtesy of Paul E. Schulz, M.D., Department of Neurology, Baylor College of Medicine, Houston, Texas.
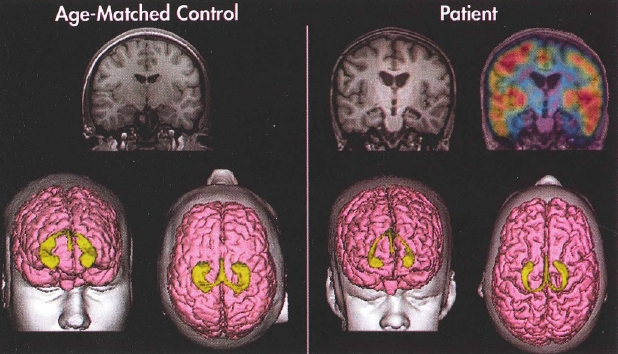
Plate 4. (Figure 4-7) Structural magnetic resonance imaging (MRI) and positron emission tomography (PET) imaging of a healthy control subject and a patient with traumatic brain injury.
Coronal slices (MRI) and three-dimensional reconstruction of the cortical surface (pink) and hippocampi (yellow) of a typically developing adolescent male (left) and an adolescent male with traumatic brain injury (right). Note the significant cortical and hippocampal atrophy in the patient as compared with the age-matched control. The top right image portrays PET findings overlaid on the MRI. PET reveals significant bilateral metabolic defects in the patient's mesial temporal areas as indicated by the absence of "warm" colors. Red represents areas of the greatest metabolic activity, followed by orange, yellow, green, blue, and violet.
Source. Images courtesy of Erin Bigler, Ph.D., University of Utah, Salt Lake City, Utah.
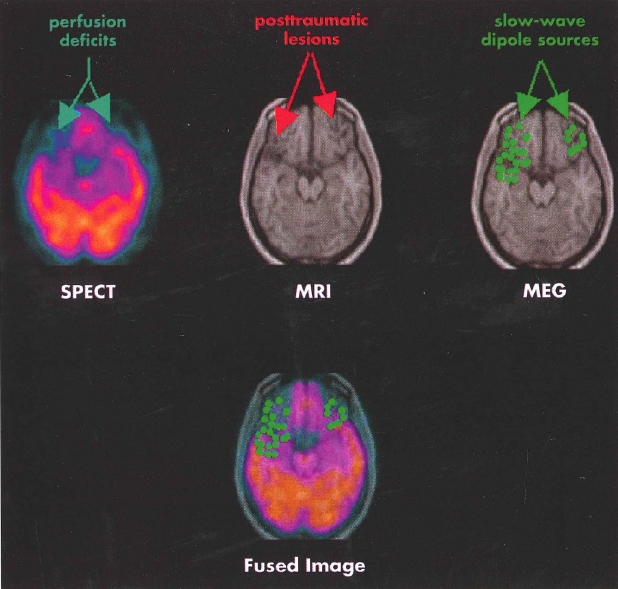
Plate 5.(Figure 4-8) Single photon emission computed tomography (SPECT), structural magnetic resonance imaging (MRI), and magnetoencephalography (MEG) imaging of a patient with traumatic brain injury.
Findings from multiple neuroimaging modalities in a patient with traumatic brain injury reveal structural and functional deficits in the inferior frontal and temporal regions, common sites of focal injury in head trauma. Functional imaging reveals even more extensive defects in perfusion (SPECT, left) and dipole abnormality (MEG, right) than the areas of focal injury evident on structural MRI (center). The fused image (bottom) displays the results of the SPECT and MEG overlaid on the MRI.
Source. Images courtesy of Erin Bigler, Ph.D., University of Utah, Salt Lake City, Utah.

Plate 6. (Figure 12-2) Clusters in which significant hyperactivation or hypoactivation was found in patients with posttraumatic stress disorder (PTSD), social anxiety disorder, and specific phobia relative to comparison subjects and in healthy subjects undergoing fear conditioning.
Results are shown for the amygdalae (A) and insular cortices (B). Note that within the left amygdala there were two distinct clusters for PTSD, a ventral anterior hyperactivation cluster and a dorsal posterior hypoactivation cluster. The right side of the image corresponds to the right side of the brain.
Source. Reprinted from Etkin A, Wager TD: "Functional Neuroimaging of Anxiety: A Meta-Analysis of Emotional Processing in PTSD, Social Anxiety Disorder, and Specific Phobia." American Journal of Psychiatry 164(10):1476-1488, 2007. Copyright 2007, American Psychiatric Association. Used with permission.
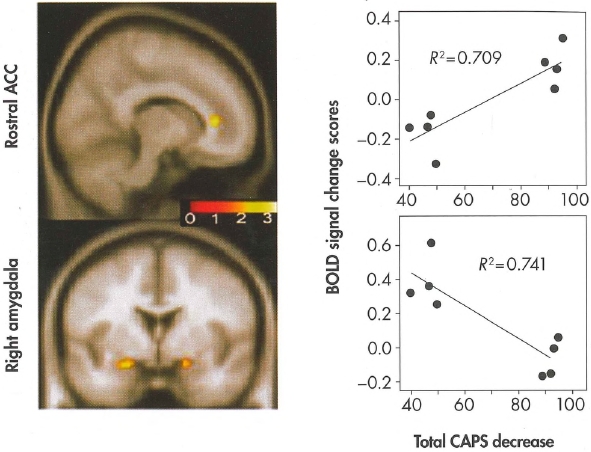
Plate 7. (Figure 14-2) Correlation between changes in blood-oxygenation-lev-el-dependent (BOLD) activity and changes in total severity of posttraumatic stress disorder (PTSD)—i.e., changes in total score on the Clinician-Administered PTSD Scale (CAPS)—following exposure-based treatment.
The functional maps display the areas where changes in BOLD activity in anterior cingulate cortex (ACC) and amygdala correlated with changes in total CAPS score; the color scale represents the strength of the correlation. The scatter plots display the direction of these correlations (improvement on total CAPS on the horizontal axis; extent of BOLD activity on the vertical axis).
Source. Courtesy of Dr. Kim Felmingham. Image prepared by Dr. Felmingham and used with her permission.
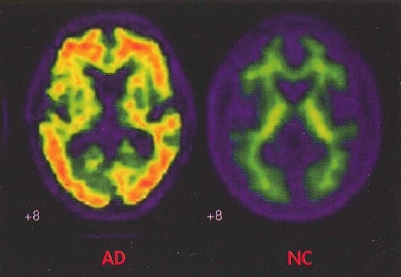
Plate 8. (Figure 24-1) In vivo amyloid imaging.
Florbetapir imaging (coronal view) shows no amyloid accumulation in the brain of a normal control subject (NC) and extensive accumulation in the brain of a patient with Alzheimer's disease (AD).
Source. Image courtesy of Dr. M.D. Devous, Sr.
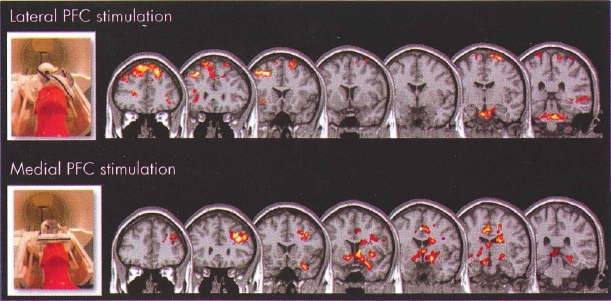
Plate 9. (Figure 28-1) Transcranial magnetic stimulation (TMS) opens "cortical windows."
These are group blood oxygen level dependent (BOLD) functional magnetic resonance imaging (fMRI) activation maps using an optimized interleaved transcranial magnetic stimulation (TMS)/BOLD sequence in two cortical targets to examine the differential activation of lateral and medial neural circuits, which are known to be important in drug abuse or mood regulation, or both.
Interleaved TMS/BOLD imaging data were acquired for 10 healthy individuals who received TMS in two runs with the coil positioned over the (top) dorsolateral prefrontal cortex (DLPFC) and (bottom) medial prefrontal cortex (mPFC). DLPFC TMS was associated with a significant elevation of BOLD signal in multiple dorsal cortical areas, whereas mPFC TMS was associated with a significant elevation of BOLD signal in multiple medial and limbic subcortical areas. These preliminary data demonstrate that cortical TMS produces secondary effects deeper in the brain. TMS is thus opening cortical windows into different brain circuits, depending on the connectivity pattern of the cortical region being stimulated.
Source. Images derived from work by Dr. Colleen Hanlon and colleagues at the Medical University of South Carolina (Hanlon and Centerberry 2012; Li et al. 2004b). Used with permission.