
|
Though this be madness, yet there is method in’t.
~ William Shakespeare
|
Chapter 3
Methods of Cognitive Neuroscience
OUTLINE
Cognitive Psychology and Behavioral Methods
Studying the Damaged Brain
Methods to Perturb Neural Function
Structural Analysis of the Brain
Methods for the Study of Neural Function
The Marriage of Function and Structure: Neuroimaging
Brain Graphs
Computer Modeling
Converging Methods
IN THE YEAR 2010, Halobacterium halobium and Chlamydomonas reinhardtii made it to prime time as integral parts of the journal Nature’s “Method of the Year.” These microscopic creatures were hailed for their potential to treat a wide range of neurological and psychiatric conditions: anxiety disorder, depression, and Parkinson’s disease, just to name a few. Not bad for a bacterium that hangs out in warm brackish waters and an alga more commonly known as pond scum.
Such grand ambitions for these humble creatures likely never occurred to Dieter Oesterhelt and Walther Stoeckenius (1971), biochemists who wanted to understand why the salt-loving Halobacterium, when removed from its salty environment, would break up into fragments, and why one of these fragments took on an unusual purple hue. Their investigations revealed that the purple color was due to the interaction of retinal (a form of vitamin A) and a protein produced by a set of “opsin genes.” Thus they dubbed this new compound bacteriorhodopsin. The particular combination surprised them. Previously, the only other place where the combined form of retinal and an opsin protein had been observed was in the mammalian eye, where it serves as the chemical basis for vision. In Halobacterium, bacteriorhodopsin functions as an ion pump, converting light energy into metabolic energy as it transfers ions across the cell membrane. Other members of this protein family were identified over the next 25 years, including channelrhodopsin from the green algae C. reinhardtii (Nagel et al., 2002). The light-sensitive properties of microbial rhodopsins turned out to provide just the mechanism that neuroscientists had been dreaming of.
In 1979, Francis Crick, a codiscoverer of the structure of DNA, made a wish list for neuroscientists. What neuroscientists really need, he suggested, was a way to selectively switch on and off neurons, and to do so with great temporal precision. Assuming this manipulation did not harm the cell, a technique like this would enable researchers to directly probe how neurons functionally relate to each other in order to control behavior. Twenty years later, Crick (1999) proposed that light might somehow serve as the switch, because it could be precisely delivered in timed pulses. Unknown to him, and the neuroscience community in general, the key to developing this switch was moldering away in the back editions of plant biology journals, in the papers inspired by Oesterhelt and Stoeckenius’s work on the microbial rhodopsins.
A few years later, Gero Miesenböck provided the first demonstration of how photoreceptor proteins could control neuroactivity. The key challenge was getting the proteins into the cell. Miesenböck accomplished this feat by inserting genes that, when expressed, made targeted cells light responsive (Zemmelman et al., 2002). Expose the cell to light, and the neuron would fire. With this methodological breakthrough, optogenetics was born (Figure 3.1).
Miesenböck’s initial compound proved to have limited usefulness, however. But just a few years later, two graduate students at Stanford, Karl Deisseroth and Ed Boyden, became interested in the opsins as possible neuronal switches (Boyden, 2011). They focused on channelrhodopsin-2 (ChR-2), since a single gene encodes this opsin, making it easier to use molecular biology tools. Using Miesenböck’s technique, a method that has come to be called viral transduction, they spliced the gene for ChR-2 into a neutral virus and then added this virus to a culture of live nerve cells growing in a petri dish. The virus acted like a ferry, carrying the gene into the cell. Once the ChR-2 gene was inside the neurons and the protein had been expressed, Deisseroth and Boyden performed the critical test: They projected a light beam onto the cells. Immediately, the targeted cells began to respond. By pulsing the light, the researchers were able to do exactly what Crick had proposed: precisely control the neuronal activity. Each pulse of light stimulated the production of an action potential; and when the pulse was discontinued, the neuron shut down.
Emboldened by this early success, Deisseroth and Boyden set out to see if the process could be repeated in live animals, starting with a mouse model. Transduction methods were widely used in molecular biology, but it was important to verify that ChR-2 would be expressed in targeted tissue and that the introduction of this rhodopsin would not damage the cells. Another challenge these scientists faced was the need to devise a method of delivering light pulses to the transduced cells. For their initial in vivo study, they implanted a tiny optical fiber in the part of the brain containing motor neurons that control the mouse’s whiskers. When a blue light was pulsed, the whiskers moved (Aravanis et al., 2007). Archimedes, as well as Frances Crick, would have shouted, “Eureka!”
a
|
c
|
b
|
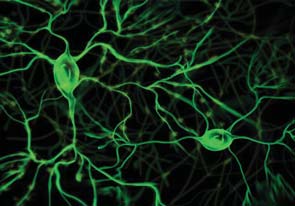
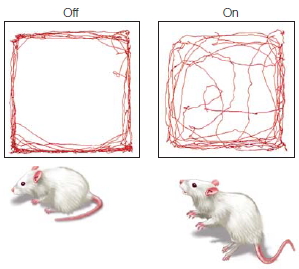
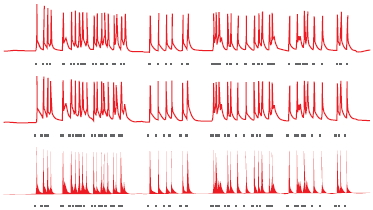
FIGURE 3.1 Optogenetic control of neural activity.
(a) Hippocampal neuron that has been genetically modified to express Channelrhododopsin-2, a protein which forms light-gated ion channels. (b) Activity in three neurons when exposed to a blue light. The small grey dashes below each neuron indicate when the light was turned on (same stimulus for all three neurons). The firing pattern of the cells is tightly coupled to the light, indicating the experimenter can control, to a large extent, the activity of the cells. (c) Behavioral changes resulting from optogenetic stimulation of cells in a subregion of the amygdala. When placed in an open, rectangular arena, mice generally stay close to the walls. With amygdala activation, the mice become less fearful, venturing out into the open part of the arena.
|
The overarching method that neuroscientists use, of course, is the scientific method. This process begins with an observation of a phenomenon. Such an observation can come from various types of populations: animal or human, normally functioning or abnormally functioning. The scientist devises a hypothesis to explain an observation and makes predictions drawn from the hypothesis. The next step is designing experiments to test the hypothesis and its predictions. Such experiments employ the various methods that we discuss in this chapter. Experiments cannot prove that a hypothesis is true. Rather, they can provide support for a hypothesis. Even more important, experiments can be used to disprove a hypothesis, providing evidence that a prevailing idea must be modified. By documenting this process and having it repeated again and again, the scientific method allows our understanding of the world to progress.
Optogenetic techniques are becoming increasingly versatile (for a video on optogenetics, see http://spie.org/x48167.xml?ArticleID=x48167). Many new opsins have been discovered, including ones that respond to different colors of visible light. Others respond to infrared light. Infrared light is advantageous because it penetrates tissue, and thus, it may eliminate the need for implanting optical fibers to deliver the light pulse to the target tissue. Optogenetic methods have been used to turn on and off cells in many parts of the brain, providing experimenters with new tools to manipulate behavior. A demonstration of the clinical potential of this method comes from a recent study in which optogenetic methods were able to reduce anxiety in mice (Tye et al., 2011). After creating light-sensitive neurons in their amygdala (see Chapter 10), a flash of light was sufficient to motivate the mice to move away from the wall of their home cage and boldly step out into the center. Interestingly, this effect worked only if the light was targeted at a specific subregion of the amygdala. If the entire structure was exposed to the light, the mice remained anxious and refused to explore their cages.
Theoretical breakthroughs in all scientific domains can be linked to the advent of new methods and the development of novel instrumentation. Cognitive neuroscience is no exception. It is a field that emerged in part because of the invention of new methods, some of which use advanced tools unavailable to scientists of previous generations (see Chapter 1; Sejnowski & Churchland, 1989). In this chapter, we discuss how these methods work, what information can be derived from them, and their limitations. Many of these methods are shared with other players in the neurosciences, from neurologists and neurosurgeons to physiologists and philosophers. Cognitive neuroscience endeavors to take advantage of the insights that each approach has to offer and combine them. By addressing a question from different perspectives and with a variety of techniques, the conclusions arrived at can be made with more confidence.
We begin the chapter with cognitive psychology and the behavioral methods it uses to gain insight into how the brain represents and manipulates information. We then turn to how these methods have been used to characterize the behavioral changes that accompany neurological insult or disorder, the subfield traditionally known as neuropsychology. While neuropsychological studies of human patients are dependent on the vagaries of nature, the basic logic of the approach is now pursued with methods in which neural function is deliberately perturbed. We review a range of methods used to perturb neural function. Following this, we turn to more observational methods, first reviewing ways in which cognitive neuroscientists measure neurophysiological signals in either human or animal models, and second, by examining methods in which neural structure and function are inferred through measurements of metabolic and hemodynamic processes. When studying an organ with 11 billion basic elements and gazillions of connections between these elements, we need tools that can be used to organize the data and yield simplified models to evaluate hypotheses. We provide a brief overview of computer modeling and how it has been used by cognitive neuroscientists, and we review a powerful analytical and modeling tool—brain graph theory, which transforms neuroimaging data into models that elucidate the network properties of the human brain. The interdisciplinary nature of cognitive neuroscience has depended on the clever ways in which scientists have integrated paradigms across all of these fields and methodologies. The chapter concludes with examples of this integration. Andiamo!
Cognitive Psychology and Behavioral Methods
Cognitive neuroscience has been informed by the principles of cognitive psychology, the study of mental activity as an information-processing problem. Cognitive psychologists are interested in describing human performance, the observable behavior of humans (and other animals). They also seek to identify the internal processing—the acquisition, storage, and use of information—that underlies this performance. A basic assumption of cognitive psychology is that we do not directly perceive and act in the world. Rather, our perceptions, thoughts, and actions depend on internal transformations or computations. Information is obtained by sense organs, but our ability to comprehend that information, to recognize it as something that we have experienced before and to choose an appropriate response, depend on a complex interplay of processes. Cognitive psychologists design experiments to test hypotheses about mental operations by adjusting what goes into the brain and then seeing what comes out. Put more simply, information is input into the brain, something secret happens to it, and out comes behavior. Cognitive psychologists are detectives trying to figure out what those secrets are.
For example, input this text into your brain and let’s see what comes out:
ocacdrngi ot a sehrerearc ta maccbriegd ineyurvtis, ti edost’n rttaem ni awth rreod eht tlteser ni a rwdo rea, eht ylon pirmtoatn gihtn si atth het rifts nda satl ttelre eb tat het ghitr clepa. eht srte anc eb a otlta sesm dan ouy anc itlls arde ti owtuthi moprbel. ihst si cebusea eth nuamh nidm sedo otn arde yrvee telrte yb stifle, tub eth rdow sa a lohew.
Not much, eh? Now take another shot at it:
Aoccdrnig to a rseheearcr at Cmabrigde Uinervtisy, it deosn’t mttaer in waht oredr the ltteers in a wrod are, the olny iprmoatnt tihng is taht the frist and lsat ltteer be at the rghit pclae. The rset can be a total mses and you can sitll raed it wouthit porbelm. Tihs is bcuseae the huamn mnid deos not raed ervey lteter by istlef, but the wrod as a wlohe.
Oddly enough, the second version makes sense. It is surprisingly easy to read the second passage, even though only a few words are correctly spelled. As long as the first and last letters of each word are in the correct position, we can accurately infer the correct spelling, especially when the surrounding context helps generate expectations for each word. Simple demonstrations like this one help us discern the content of mental representations, and thus, help us gain insight into how information is manipulated by the mind.
Cognitive neuroscience is distinctive in the study of the brain and behavior, because it combines paradigms developed in cognitive psychology with methods employed to study brain structure and function. Next, we introduce some of those paradigms.
Ferreting Out Mental Representations and Transformations
Two key concepts underlie the cognitive approach:
- Information processing depends on internal representations.
- These mental representations undergo transformations.
Mental Representations We usually take for granted the idea that information processing depends on internal representations. Consider the concept “ball.” Are you thinking of an image, a word description, or a mathematical formula? Each instance is an alternative form of representing the “circular” or “spherical” concept and depends on our visual system, our auditory system, our ability to comprehend the spatial arrangement of a curved drawing, our ability to comprehend language, or our ability to comprehend geometric and algebraic relations. The context would help dictate which representational format would be most useful. For example, if we wanted to show that the ball rolls down a hill, a pictorial representation is likely to be much more useful than an algebraic formula—unless you are doing your physics final, where you would likely be better off with the formula.
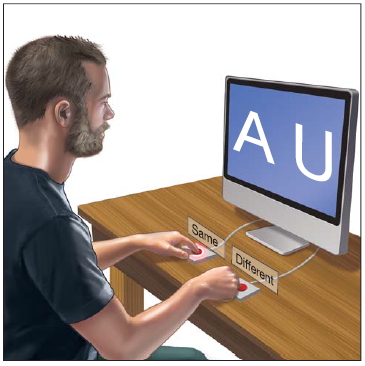
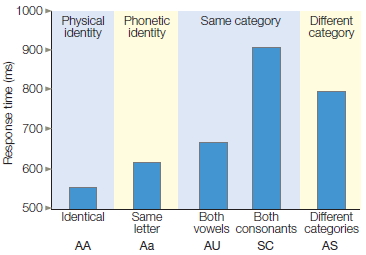
A letter-matching task, first introduced by Michael Posner (1986) at the University of Oregon, provides a powerful demonstration that even with simple stimuli, the mind derives multiple representations (Figure 3.2). Two letters are presented simultaneously in each trial. The participant’s task is to evaluate whether they are both vowels, both consonants, or one vowel and one consonant. The participant presses one button if the letters are from the same category, and the other button if they are from different categories.
One version of this experiment includes five conditions. In the physical-identity condition, the two letters are exactly the same. In the phonetic-identity condition, the two letters have the same identity, but one letter is a capital and the other is lowercase. There are two types of samecategory conditions, conditions in which the two letters are different members of the same category. In one, both letters are vowels; in the other, both letters are consonants.
Experiments like the one represented in Figure 3.2 involve manipulating one variable and observing its effect on another variable. The variable that is manipulated is called the independent variable. It is what you (the researcher) have changed. In this example, the relationship of the two letters is the independent variable, defining the conditions of the experiment (e.g., Identical, Same letter, Both vowels, etc.). The dependent variable is the event being studied. In this example, it is the response time of the participant. When graphing the results of an experiment, the independent variable is displayed on the horizontal axis (Figure 3.2b) and the dependent variable is displayed on the vertical axis. Experiments can involve more than one independent and dependent variable.
Finally, in the different-category condition, the two letters are from different categories and can be either of the same type size or of different sizes. Note that the first four conditions—physical identity, phonetic identity, and the two same-category conditions—require the “same” response: On all three types of trials, the correct response is that the two letters are from the same category. Nonetheless, as Figure 3.2b shows, response latencies differ significantly. Participants respond fastest to the physical-identity condition, next fastest to the phonetic-identity condition, and slowest to the same-category condition, especially when the two letters are both consonants.
The results of Posner’s experiment suggest that we derive multiple representations of stimuli. One representation is based on the physical aspects of the stimulus. In this experiment, it is a visually derived representation of the shape presented on the screen. A second representation corresponds to the letter’s identity. This representation reflects the fact that many stimuli can correspond to the same letter. For example, we can recognize that A, a, and a all represent the same letter. A third level of abstraction represents the category to which a letter belongs. At this level, the letters A and E activate our internal representation of the category “vowel.” Posner maintains that different response latencies reflect the degrees of processing required to perform the letter-matching task. By this logic, we infer that physical representations are activated first, phonetic representations next, and category representations last.
|
|
|
a
|
b
|
|
FIGURE 3.2 Letter-matching task.
(a) Participants press one of two buttons to indicate if the letters are the same or different. The definition of “same” and “different” is manipulated across different blocks of the experiment. (b) The relationship between the two letters is plotted on the x-axis. This relationship is the independent variable, the variable that the experimenter is manipulating. Reaction time is plotted on the y-axis. It is the dependent variable, the variable that the experimenter is measuring.
|
As you may have experienced personally, experiments like these elicit as many questions as answers. Why do participants take longer to judge that two letters are consonants than they do to judge that two letters are vowels? Would the same advantage for identical stimuli exist if the letters were spoken? What about if one letter were visual and the other were auditory? Cognitive psychologists address questions like these and then devise methods for inferring the mind’s machinery from observable behaviors.
In the letter-matching task, the primary dependent variable was reaction (or response) time, the speed with which participants make their judgments. Reaction time experiments use the chronometric methodology. Chronometric comes from the Greek words chronos (“time”) and metron (“measure”). The chronometric study of the mind is essential for cognitive psychologists because mental events occur rapidly and efficiently. If we consider only whether a person is correct or incorrect on a task, we miss subtle differences in performance. Measuring reaction time permits a finer analysis of the brain’s internal processes.
Internal Transformations The second critical notion of cognitive psychology is that our mental representations undergo transformations. For instance, the transformation of mental representations is obvious when we consider how sensory signals are connected with stored information in memory. For example, a whiff of garlic may transport you to your grandmother’s house or to a back alley in Palermo, Italy. In this instance, an olfactory sensation has somehow been transformed by your brain, allowing this stimulus to call up a memory. Taking action often requires that perceptual representations be translated into action representations in order to achieve a goal. For example, you see and smell garlic bread on the table at dinner. These sensations are transformed into perceptual representations, which are then processed by the brain, allowing you to decide on a course of action and to carry it out—pick up the bread and place it in your mouth. Take note, though, that information processing is not simply a sequential process from sensation to perception to memory to action. Memory may alter how we perceive something. When you see a dog, do you reach out to pet it, perceiving it as cute, or do you draw back in fear, perceiving it as dangerous, having been bitten when you were a child? The manner in which information is processed is also subject to attentional constraints. Did you register that last sentence, or did all the talk about garlic cause your attention to wander as you made plans for dinner? Cognitive psychology is all about how we manipulate representations.
Characterizing Transformational Operations Suppose you arrive at the grocery store and discover that you forgot to bring your shopping list. You know for sure that you need coffee and milk, the main reason you came; but what else? As you cruise the aisles, scanning the shelves, you hope something will prompt your memory. Is the peanut butter gone? How many eggs are left?
This memory retrieval task draws on a number of cognitive capabilities. As we have just learned, the fundamental goal of cognitive psychology is to identify the different mental operations or transformations that are required to perform tasks such as this.
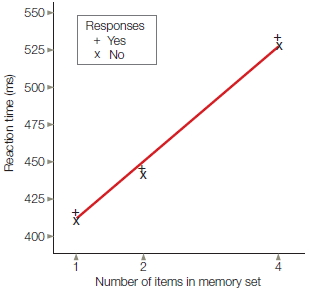
Saul Sternberg (1975) introduced an experimental task that bears some similarity to the problem faced by an absentminded shopper. In Sternberg’s task, however, the job is not recalling items stored in memory, but rather comparing sensory information with representations that are active in memory. In each trial, the participant is first presented with a set of letters to memorize (Figure 3.3a). The memory set could consist of one, two, or four letters. Then a single letter is presented, and the participant must decide if this letter was part of the memorized set. The participant presses one button to indicate that the target was part of the memory set (“yes” response) and a second button to indicate that the target was not part of the set (“no” response). Once again, the primary dependent variable is reaction time.
Sternberg postulated that, to respond on this task, the participant must engage in four primary mental operations:
- Encode. The participant must identify the visible target.
- Compare. The participant must compare the mental representation of the target with the representations of the items in memory.
- Decide. The participant must decide whether the target matches one of the memorized items.
- Respond. The participant must respond appropriately for the decision made in step 3.
By postulating a set of mental operations, we can devise experiments to explore how these putative mental operations are carried out.
A basic question for Sternberg was how to characterize the efficiency of recognition memory. Assuming that all items in the memory set are actively represented, the recognition process might work in one of two ways: A highly efficient system might simultaneously compare a representation of the target with all of the items in the memory set. On the other hand, the recognition process might be able to handle only a limited amount of information at any point in time. For example, it might require that each item in memory be compared successively to a mental representation of the target.

|
|
|
a
|
b
|
|
FIGURE 3.3 Memory comparison task.
(a) The participant is presented with a set of one, two, or four letters and asked to memorize them. After a delay, a single probe letter appears, and the participant indicates whether that letter was a member of the memory set. (b) Reaction time increases with set size, indicating that the target letter must be compared with the memory set sequentially rather than in parallel.
|
Sternberg realized that the reaction time data could distinguish between these two alternatives. If the comparison process can be simultaneous for all items—what is called a parallel process—then reaction time should be independent of the number of items in the memory set. But if the comparison process operates in a sequential, or serial, manner, then reaction time should slow down as the memory set becomes larger, because more time is required to compare an item with a large memory list than with a small memory list. Sternberg’s results convincingly supported the serial hypothesis. In fact, reaction time increased in a constant, or linear, manner with set size, and the functions for the “yes” and “no” trials were essentially identical (Figure 3.3b).
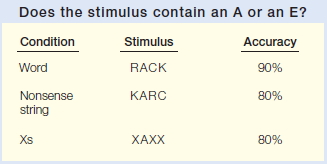
FIGURE 3.4 Word superiority effect.
Participants are more accurate in identifying the target vowel when it is embedded in a word. This result suggests that letter and word levels of representation are activated in parallel.
Although memory comparison appears to involve a serial process, much of the activity in our mind operates in parallel. A classic demonstration of parallel processing is the word superiority effect (Reicher, 1969). In this experiment, a stimulus is shown briefly and participants are asked which of two target letters (e.g., A or E) was presented. The stimuli can be composed of words, nonsense letter strings, or letter strings in which every letter is an X except for the target letter (Figure 3.4). Brief presentation times are used so that errors will be observed, because the critical question centers on whether context affects performance. The word superiority effect (see Figure 3.4 caption) refers to the fact that participants are most accurate in identifying the target letter when the stimuli are words. As we saw earlier, this finding suggests that we do not need to identify all the letters of a word before we recognize the word. Rather, when we are reading a list of words, representations corresponding to the individual letters and to the entire word are activated in parallel for each item. Performance is facilitated because both representations can provide information as to whether the target letter is present.
Constraints on Information Processing
In the memory search experiment, participants are not able to compare the target item to all items in the memory set simultaneously. That is, their processing ability is constrained. Whenever a constraint is identified, an important question to ask is whether the constraint is specific to the system that you are investigating (in this case, memory) or if it is a more general processing constraint. Obviously, people can do only a certain amount of internal processing at any one time, but we also experience task-specific constraints. Processing constraints are defined only by the particular set of mental operations associated with a particular task. For example, although the comparison (item 2 in Sternberg’s list) of a probe item to the memory set might require a serial operation, the task of encoding (item 1 in Sternberg’s list) might occur in parallel, so it would not matter whether the probe was presented by itself or among a noisy array of competing stimuli.
Exploring the limitations in task performance is a central concern for cognitive psychologists. Consider a simple color-naming task—devised in the early 1930s by J. R. Stroop, an aspiring doctoral student (1935; for a review, see MacLeod, 1991)—that has become one of the most widely employed tasks in all of cognitive psychology. We will refer to this task many times in this book. The Stroop task involves presenting the participant with a list of words and then asking her to name the color of each word as fast as possible. As Figure 3.5 illustrates, this task is much easier when the words match the ink colors.
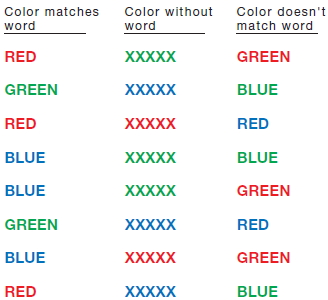
FIGURE 3.5 Stroop task.
Time yourself as you work through each column, naming the color of the ink of each stimulus as fast as possible. Assuming that you do not squint to blur the words, it should be easy to read the first and second columns but quite difficult to read the third.
The Stroop effect powerfully demonstrates the multiplicity of mental representations. The stimuli in this task appear to activate at least two separable representations. One representation corresponds to the color of each stimulus; it is what allows the participant to perform the task. The second representation corresponds to the color concept associated with each word. Participants are slower to name the colors when the ink color and words are mismatched, thus indicating that the second representation is activated, even though it is irrelevant to the task. Indeed, the activation of a representation based on the word rather than the color of the word appears to be automatic.
The Stroop effect persists even after thousands of trials of practice, because skilled readers have years of practice in analyzing letter strings for their symbolic meaning. On the other hand, the interference from the words is markedly reduced if the response requires a key press rather than a vocal response. Thus, the word-based representations are closely linked to the vocal response system and have little effect when the responses are produced manually.
TAKE-HOME MESSAGES
- Cognitive psychology focuses on understanding how objects or ideas are represented in the brain and how these representations are manipulated.
- Fundamental goals of cognitive psychology include identifying the mental operations that are required to perform cognitive tasks and exploring the limitations in task performance.
Studying the Damaged Brain
An integral part of cognitive neuroscience research methodology is choosing the population to be studied. Study populations fall into four broad groups: animals and humans that are neurologically intact, and animals and humans in which the neurological system is abnormal, either as a result of an illness or a disorder, or as a result of experimental manipulation. The population a researcher picks to study depends, at least in part, on the questions being asked. We begin this section with a discussion of the major natural causes of brain dysfunction. Then we consider the different study populations, their limitations, and the methods used with each group.
Causes of Neurological Dysfunction
Nature has sought to ensure that the brain remains healthy. Structurally, the skull provides a thick, protective encasement, engendering such comments as “hardheaded” and “thick as a brick.” The distribution of arteries is extensive, ensuring an adequate blood supply. Even so, the brain is subject to many disorders, and their rapid treatment is frequently essential to reduce the possibility of chronic, debilitating problems or death. We discuss some of the more common types of disorders.
Vascular Disorders As with all other tissue, neurons need a steady supply of oxygen and glucose. These substances are essential for the cells to produce energy, fire action potentials, and make transmitters for neural communication. The brain, however, is a hog. It uses 20 % of all the oxygen we breathe, an extraordinary amount considering that it accounts for only 2 % of the total body mass. What’s more, a continuous supply of oxygen is essential: A loss of oxygen for as little as 10 minutes can result in neural death. Angiography is a clinical imaging method used to evaluate the circulatory system in the brain and diagnose disruptions in circulation. As Figure 3.6 shows, this method helps us visualize the distribution of blood by highlighting major arteries and veins. A dye is injected into the vertebral or carotid artery and then an X-ray study is conducted.
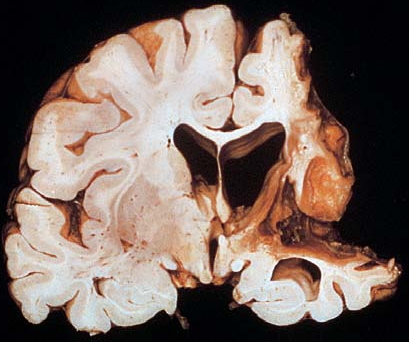
Cerebral vascular accidents, or strokes, occur when blood flow to the brain is suddenly disrupted. The most frequent cause of stroke is occlusion of the normal passage of blood by a foreign substance. Over years, atherosclerosis, the buildup of fatty tissue, occurs in the arteries. This tissue can break free, becoming an embolus that is carried off in the bloodstream. An embolus that enters the cranium may easily pass through the large carotid or vertebral arteries. As the arteries and capillaries reach the end of their distribution, however, their size decreases. Eventually, the embolus becomes stuck, or infarcted, blocking the flow of blood and depriving all downstream tissue of oxygen and glucose. Within a short time, this tissue will become dysfunctional. If the blood flow is not rapidly restored, the cells will die (Figure 3.7a).
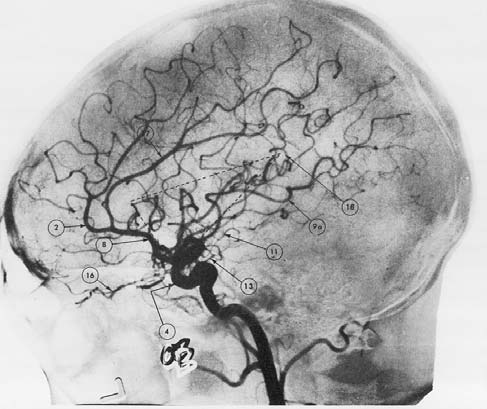
FIGURE 3.6 The brain’s blood supply.
The angiogram provides an image of the arteries in the brain.
The onset of stroke can be quite varied, depending on the afflicted area. Sometimes the person may lose consciousness and die within minutes. In such cases the infarct is usually in the vicinity of the brainstem. When the infarct is cortical, the presenting symptoms may be striking, such as sudden loss of speech and comprehension. In other cases, the onset may be rather subtle. The person may report a mild headache or feel clumsy in using one of his or her hands. The vascular system is fairly consistent between individuals; thus, stroke of a particular artery typically leads to destruction of tissue in a consistent anatomical location. For example, occlusion of the posterior cerebral artery invariably leads to deficits in visual perception.
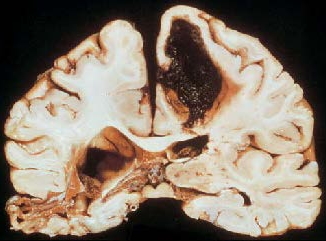
There are many other types of cerebral vascular disorders. Ischemia can be caused by partial occlusion of an artery or a capillary due to an embolus, or it can arise from a sudden drop in blood pressure that prevents blood from reaching the brain. A sudden rise in blood pressure can lead to cerebral hemorrhage (Figure 3.7b), or bleeding over a wide area of the brain due to the breakage of blood vessels. Spasms in the vessels can result in irregular blood flow and have been associated with migraine headaches.
Other disorders are due to problems in arterial structures. Cerebral arteriosclerosis is a chronic condition in which cerebral blood vessels become narrow because of thickening and hardening of the arteries. The result can be persistent ischemia. More acute situations can arise if a person has an aneurysm, a weak spot or distention in a blood vessel. An aneurysm may suddenly expand or even burst, causing a rapid disruption of the blood circulation.
Tumors Brain lesions also can result from tumors. A tumor, or neoplasm, is a mass of tissue that grows abnormally and has no physiological function. Brain tumors are relatively common; most originate in glial cells and other supporting white matter tissues. Tumors also can develop from gray matter or neurons, but these are much less common, particularly in adults. Tumors are classified as benign when they do not recur after removal and tend to remain in the area of their germination (although they can become quite large). Malignant, or cancerous, tumors are likely to recur after removal and are often distributed over several different areas. With brain tumors, the first concern is not usually whether the tumor is benign or malignant, but rather its location and prognosis. Concern is greatest when the tumor threatens critical neural structures. Neurons can be destroyed by an infiltrating tumor or become dysfunctional as a result of displacement by the tumor.
|
|
|
a
|
b
|
|
FIGURE 3.7 Vascular disorders of the brain.
(a) Strokes occur when blood flow to the brain is disrupted. This brain is from a person who had an occlusion of the middle cerebral artery. The person survived the stroke. After death, a postmortem analysis shows that almost all of the tissue supplied by this artery had died and been absorbed. (b) Coronal section of a brain from a person who died following a cerebral hemorrhage. The hemorrhage destroyed the dorsomedial region of the left hemisphere. The effects of a cerebrovascular accident 2 years before death can be seen in the temporal region of the right hemisphere.
|
Degenerative And Infectious Disorders Many neurological disorders result from progressive disease. Table 3.1 lists some of the more prominent degenerative and infectious disorders. In later chapters, we will review some of these disorders in detail, exploring the cognitive problems associated with them and how these problems relate to underlying neuropathologies. Here, we focus on the etiology and clinical diagnosis of degenerative disorders.
Degenerative disorders have been associated with both genetic aberrations and environmental agents. A prime example of a degenerative disorder that is genetic in origin is Huntington’s disease. The genetic link in degenerative disorders such as Parkinson’s disease and Alzheimer’s disease is weaker. Environmental factors are suspected to be important, perhaps in combination with genetic predispositions.
|
table 3.1 Prominent Degenerative and Infectious Disorders of the Central Nervous System
|
|
Disorder
|
Type
|
Most Common Pathology
|
| Alzheimer’s disease | Degenerative | Tangles and plaques in limbic and temporoparietal cortex |
| Parkinson’s disease | Degenerative | Loss of dopaminergic neurons |
| Huntington’s disease | Degenerative | Atrophy of interneurons in caudate and putamen nuclei of basal ganglia |
| Pick’s disease | Degenerative | Frontotemporal atrophy |
| Progressive supranuclear palsy (PSP) | Degenerative | Atrophy of brainstem, including colliculus |
| Multiple sclerosis | Possibly infectious | Demyelination, especially of fibers near ventricles |
| AIDS dementia | Viral infection | Diffuse white matter lesions |
| Herpes simplex | Viral infection | Destruction of neurons in temporal and limbic regions |
| Korsakoff’s syndrome | Nutritional deficiency | Destruction of neurons in diencephalon and temporal lobes |
|
|
|
a
|
b
|
|
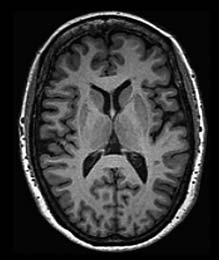
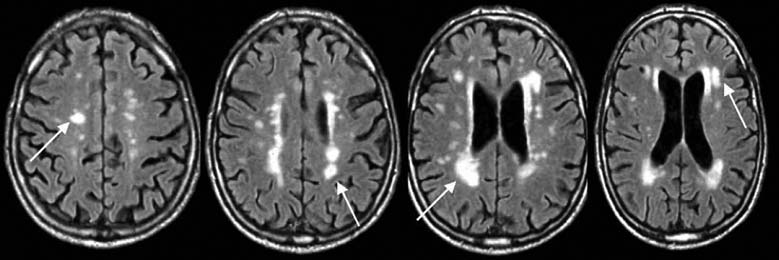
FIGURE 3.8 Degenerative disorders of the brain.
(a) Normal brain of a 60-year-old male. (b) Axial slices at four sections of the brain in a 79-year-old male with Alzheimer’s disease. Arrows show growth of white matter lesions.
|
Although neurologists were able to develop a taxonomy of degenerative disorders before the development of neuroimaging methods, diagnosis today is usually confirmed by MRI scans. The primary pathology resulting from Huntington’s disease or Parkinson’s disease is observed in the basal ganglia, a subcortical structure that figures prominently in the motor pathways (see Chapter 8). In contrast, Alzheimer’s disease is associated with marked atrophy of the cerebral cortex (Figure 3.8).
Progressive neurological disorders can also be caused by viruses. The human immunodeficiency virus (HIV) that causes dementia related to acquired immunodeficiency syndrome (AIDS) has a tendency to lodge in subcortical regions of the brain, producing diffuse lesions of the white matter by destroying axonal fibers. The herpes simplex virus, on the other hand, destroys neurons in cortical and limbic structures if it migrates to the brain. Viral infection is also suspected in multiple sclerosis, although evidence for such a link is indirect, coming from epidemiological studies. For example, the incidence of multiple sclerosis is highest in temperate climates, and some isolated tropical islands had not experienced multiple sclerosis until the population came in contact with Western visitors.
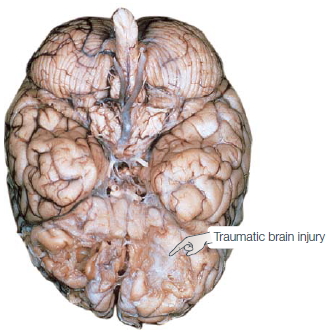
Traumatic Brain Injury More than any disease, such as stroke or tumor, most patients arrive on a neurology ward because of a traumatic event such as a car accident, a gunshot wound, or an ill-advised dive into a shallow swimming hole. Traumatic brain injury (TBI) can result from either a closed or an open head injury. In closed head injuries, the skull remains intact, but mechanical forces generated by a blow to the head damage the brain. Common causes of closed head injuries are car accidents and falls, although researchers are now recognizing that closed head TBI can be prevalent in people who have been near a bomb blast or participate in contact sports. The damage may be at the site of the blow, for example, just below the forehead—damage referred to as a coup. Reactive forces may also bounce the brain against the skull on the opposite side of the head, resulting in a countercoup. Certain regions are especially sensitive to the effects of coups and countercoups. The inside surface of the skull is markedly jagged above the eye sockets; and, as Figure 3.9 shows, this rough surface can produce extensive tearing of brain tissue in the orbitofrontal region.
An imaging method, diffusion tensor imaging (discussed later in the chapter), can be used to identify anatomical damage that can result from TBI. For example, using this method, researchers have shown that professional boxers have sustained damage in white matter tracts, even if they never had a major traumatic event (Chappell et al., 2006, Figure 3.10). Similarly, evidence is mounting that the repeated concussions suffered by football and soccer players may cause changes in neural connectivity that produce chronic cognitive problems (Shi et al., 2009).
Open head injuries happen when an object like a bullet or shrapnel penetrates the skull. With these injuries, the penetrating object may directly damage brain tissue, and the impact of the object can also create reactive forces producing coup and countercoup.
Additional damage can follow a traumatic event as a result of vascular problems and increased risk of infection. Trauma can disrupt blood flow by severing vessels, or it can change intracranial pressure as a result of bleeding. People who have experienced a TBI are also at increased risk for seizure, further complicating their recovery.
Epilepsy Epilepsy is a condition characterized by excessive and abnormally patterned activity in the brain. The cardinal symptom is a seizure, a transient loss of consciousness. The extent of other disturbances varies. Some epileptics shake violently and lose their balance. For others, seizures may be perceptible only to the most attentive friends and family. Seizures are confirmed by electroencephalography (EEG). During the seizure, the EEG profile is marked by large-amplitude oscillations (Figure 3.11).
|

|
|
a
|
b
|
|
FIGURE 3.9 Traumatic brain injury.
Trauma can cause extensive destruction of neural tissue. Damage can arise from the collision of the brain with the solid internal surface of the skull, especially along the jagged surface over the orbital region. In addition, accelerative forces created by the impact can cause extensive shearing of dendritic arbors. (a) In this brain of a 54-year-old man who had sustained a severe head injury 24 years before death, tissue damage is evident in the orbitofrontal regions and was associated with intellectual deterioration subsequent to the injury. (b) The susceptibility of the orbitofrontal region to trauma was made clear by A. Holbourn of Oxford, who in 1943 filled a skull with gelatin and then violently rotated the skull. Although most of the brain retains its smooth appearance, the orbitofrontal region has been chewed up.
|
The frequency of seizures is highly variable. The most severely affected patients have hundreds of seizures each day, and each seizure can disrupt function for a few minutes. Other epileptics suffer only an occasional seizure, but it may incapacitate the person for a couple of hours. Simply having a seizure, however, does not mean a person has epilepsy. Although 0.5 % of the general population has epilepsy, it is estimated that 5 % of people will have a seizure at some point during life, usually triggered by an acute event such as trauma, exposure to toxic chemicals, or high fever.
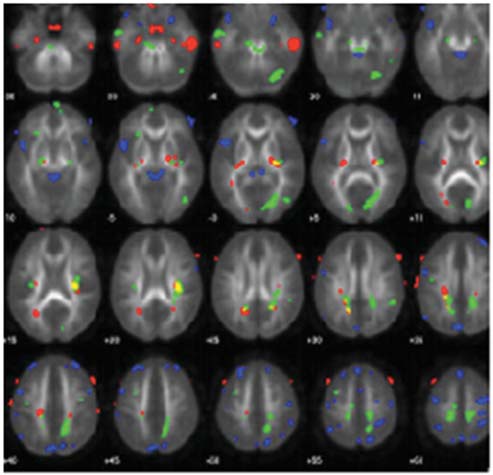
FIGURE 3.10 Sports-related TBI.
Colored regions show white matter tracts that are abnormal in the brains of professional boxers.
TAKE-HOME MESSAGES
- Brain lesions, either naturally occurring (in humans) or experimentally derived (in animals), allow experimenters to test hypotheses concerning the functional role of the damaged brain region.
- Cerebral vascular accidents, or strokes, occur when blood flow to the brain is suddenly disrupted. Angiography is used to evaluate the circulatory system in the brain.
- Tumors can cause neurological symptoms either by damaging neural tissue or by producing abnormal pressure on spared cortex and cutting off its blood supply.
- Degenerative disorders include Huntington’s disease, Parkinson’s disease, Alzheimer’s disease, and AIDSrelated dementia.
- Neurological trauma can result in damage at the site of the blow (coup) or at the site opposite the blow because of reactive forces (countercoup). Certain brain regions such as the orbitofrontal cortex are especially prone to damage from trauma.
- Epilepsy is characterized by excessive and abnormally patterned activity in the brain.

FIGURE 3.11 Electrical activity in a normal and epileptic brain.
Electroencephalographic recordings from six electrodes, positioned over the temporal (T), frontal (F), and occipital (O) cortex on both the left (L) and the right (R) sides. (a) Activity during normal cerebral activity. (b) Activity during a grand mal seizure.
Studying Brain–Behavior Relationships Following Neural Disruption
The logic of using participants with brain lesions is straightforward. If a neural structure contributes to a task, then a structure that is dysfunctional through either surgical intervention or natural causes should impair performance of that task. Lesion studies have provided key insights into the relationship between brain and behavior. Fundamental concepts, such as the left hemisphere’s dominant role in language or the dependence of visual functions on posterior cortical regions, were developed by observing the effects of brain injury. This area of research was referred to as behavioral neurology, the province of physicians who chose to specialize in the study of diseases and disorders that affect the structure and function of the nervous system.
Studies of human participants with neurological dysfunction have historically been hampered by limited information on the extent and location of the lesion. Two developments in the past half-century, however, have led to significant advances in the study of neurological patients. First, with neuroimaging methods such as computed tomography and magnetic resonance imaging, we can precisely localize brain injury in vivo. Second, the paradigms of cognitive psychology have provided the tools for making more sophisticated analyses of the behavioral deficits observed following brain injury. Early work focused on localizing complex tasks such as language, vision, executive control, and motor programming. Since then, the cognitive revolution has shaken things up. We know that these complex tasks require integrated processing of component operations that involve many different regions of the brain. By testing patients with brain injuries, researchers have been able to link these operations to specific brain structures, as well as make inferences about the component operations that underlie normal cognitive performance.
The lesion method has a long tradition in research involving laboratory animals, in large part because the experimenter can control the location and extent of the lesion. Over the years, surgical and chemical lesioning techniques have been refined, allowing for ever greater precision. Most notable are neurochemical lesions. For instance, systemic injection of 1-methyl-4-phenyl-1,2,3,6- tetrahydropyridine (MPTP) destroys dopaminergic cells in the substantia nigra, producing an animal version of Parkinson’s disease (see Chapter 8). Other chemicals have reversible effects, allowing researchers to produce a transient disruption in nerve conductivity. As long as the drug is active, the exposed neurons do not function. When the drug wears off, function gradually returns. The appeal of this method is that each animal can serve as its own control. Performance can be compared during the “lesion” and “nonlesion” periods. We will discuss this work further when we address pharmacological methods.
There are some limitations in using animals as models for human brain function. Although humans and many animals have some similar brain structures and functions, there are notable differences. Because homologous structures do not always have homologous functions, broad generalizations and conclusions are suspect. As neuroanatomist Todd Preuss (2001) put it:
The discovery of cortical diversity could not be more inconvenient. For neuroscientists, the fact of diversity means that broad generalization about cortical organization based on studies of a few “model” species, such as rats and rhesus macaques, are built on weak foundations.
Consider a study designed to explore the relationship of two aspects of memory: when we learned something and how familiar it is. The study might be designed around the following questions: Is familiarity dependent on our knowledge of when we learned something? Do these two aspects of memory depend on the same brain structures? The working hypothesis could be that these two aspects of memory are separable, and that each is associated with a particular region of the brain. A researcher designs two memory tests: one to look at memory of when information was acquired—“Do you remember when you learned that the World Trade Center Towers had been attacked?” and the second to look at familiarity—“What events occurred and in what order?”
Assuming that the study participants were selectively impaired on only one of the two memory tests, our researcher would have observed a single dissociation (Figure 1a). In a single dissociation study, when two groups are each tested on two tasks, a between-group difference is apparent in only one task. Two groups are necessary so that the participants’ performance can be compared with that of a control group. Two tasks are necessary to examine whether a deficit is specific to a particular task or reflects a more general impairment. Many conclusions in neuropsychology are based on single dissociations. For example, compared to control participants, patients with hippocampal lesions cannot develop long-term memories even though their short-term memory is intact. In a separate example, patients with Broca’s aphasia have intact comprehension but struggle to speak fluently.
Single dissociations have unavoidable problems. In particular, although the two tasks are assumed to be equally sensitive to differences between the control and experimental groups, often this is not the case. One task may be more sensitive than the other because of differences in task difficulty or sensitivity problems in how the measurements are obtained. For example, a task that measures familiarity might require a greater degree of concentration than the one that measures when a memory was learned. If the experimental group has a brain injury, it may have produced a generalized problem in concentration and the patient may have difficulty with the more demanding task. The problem, however, would not be due to a specific memory problem.
A double dissociation identifies whether two cognitive functions are independent of each other, something that a single association cannot do. In a double dissociation, group 1 is impaired on task X (but not task Y) and group 2 is impaired on task Y (but not task X; Figure 1b). Either the performances of the two groups are compared to each other, or more commonly, the patient groups are compared with a control group that shows no impairment in either task. With a double dissociation, it is no longer reasonable to argue that a difference in performance results merely from the unequal sensitivity of the two tasks. In our memory example, the claim that one group has a selective problem with familiarity would be greatly strengthened if it were shown that a second group of patients showed selective impairment on the temporal-order task. Double dissociations offer the strongest neuropsychological evidence that a patient or patient group has a selective deficit in a certain cognitive operation.
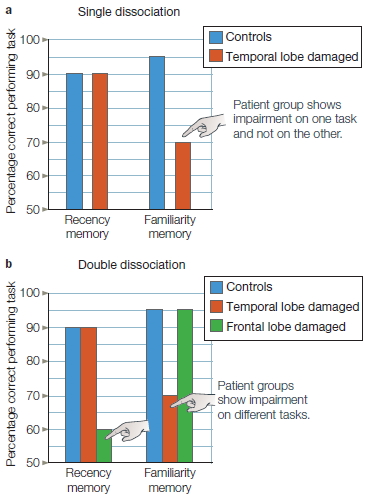
FIGURE 1 Single and double dissociations.
(a) In the single dissociation, the patient group shows impairment on one task and not on the other. (b) In the double dissociation, one patient group shows impairment on one task, and a second patient group shows impairment on the other task. Double dissociations provide much stronger evidence for a selective impairment.
In both human and animal studies, the lesion approach itself has limitations. For naturally occurring lesions associated with strokes or tumors, there is considerable variability among patients. Moreover, researchers cannot be confident that the effect of a lesion eliminates the contribution of only a single structure. The function of neural regions that are connected to the lesioned area might also be altered, either because they are deprived of their normal neural input or because their axons fail to make normal synaptic connections. The lesion might also cause the individual to develop a compensatory strategy to minimize the consequences of the lesion. For example, when monkeys are deprived of sensory feedback to one arm, they stop using the limb. However, if the sensory feedback to the other arm is eliminated later, the animals begin to use both limbs (Taub & Berman, 1968). The monkeys prefer to use a limb that has normal sensation, but the second surgery shows that they could indeed use the compromised limb.
The Lesion Approach in Humans Two methodological approaches are available when choosing a study population of participants with brain dysfunction. Researchers can either pick a population with similar anatomical lesions or assemble a population with a similar behavioral deficit. The choice will depend, among other things, on the question being asked. In the box “The Cognitive Neuroscientist’s Toolkit: Study Design,” we consider two possible experimental outcomes that might be obtained in neuropsychological studies, the single and double dissociation. Either outcome can be useful for developing functional models that inform our understanding of cognition and brain function. We also consider in that box the advantages and disadvantages of conducting such studies on an individual basis or by using groups of patients with similar lesions.
Lesion studies rest on the assumption that brain injury is eliminative—that brain injury disturbs or eliminates the processing ability of the affected structure. Consider this example. Suppose that damage to brain region A results in impaired performance on task X. One conclusion is that region A contributes to the processing required for task X. For example, if task X is reading, we might conclude that region A is critical for reading. But from cognitive psychology, we know that a complex task like reading has many component operations: fonts must be perceived, letters and letter strings must activate representations of their corresponding meanings, and syntactic operations must link individual words into a coherent stream. By merely testing reading ability, we will not know which component operation or operations are impaired when there are lesions to region A. What the cognitive neuropsychologist wants to do is design tasks that will be able to test specific hypotheses about brainfunction relationships. If a reading problem stems from a general perceptual problem, then comparable deficits should be seen on a range of tests of visual perception. If the problem reflects the loss of semantic knowledge, then the deficit should be limited to tasks that require some form of object identification or recognition.
Associating neural structures with specific processing operations calls for appropriate control conditions. The most basic control is to compare the performance of a patient or group of patients with that of healthy participants. Poorer performance by the patients might be taken as evidence that the affected brain regions are involved in the task. Thus, if a group of patients with lesions in the frontal cortex showed impairment on our reading task, we might suppose that this region of the brain was critical for reading. Keep in mind, however, that brain injury can produce widespread changes in cognitive abilities. Besides having trouble reading, the frontal lobe patient might also demonstrate impairment on other tasks, such as problem solving, memory, or motor planning. Thus the challenge for the cognitive neuroscientist is to determine whether the observed behavioral problem results from damage to a particular mental operation or is secondary to a more general disturbance. For example, many patients are depressed after a neurological disturbance such as a stroke, and depression is known to affect performance on a wide range of tasks.
Functional Neurosurgery: Intervention to Alter or Restore Brain Function
Surgical interventions for treating neurological disorders provide a unique opportunity to investigate the link between brain and behavior. The best example comes from research involving patients who have undergone surgical treatment for the control of intractable epilepsy. The extent of tissue removal is always well documented, enabling researchers to investigate correlations between lesion site and cognitive deficits. But caution must be exercised in attributing cognitive deficits to surgically induced lesions. Because the seizures have spread beyond the epileptogenic tissue, other structurally intact tissue may be dysfunctional owing to the chronic effects of epilepsy. One method used with epilepsy patients compares their performance before and after surgery. The researcher can differentiate changes associated with the surgery from those associated with the epilepsy. An especially fruitful paradigm for cognitive neuroscience has involved the study of patients who have had the fibers of the corpus callosum severed. In these patients, the two hemispheres have been disconnected—a procedure referred to as a callosotomy operation or, more informally, the split-brain procedure. The relatively few patients who have had this procedure have been studied extensively, providing many insights into the roles of the two hemispheres on a wide range of cognitive tasks. These studies are discussed more extensively in Chapter 4.
In the preceding examples, neurosurgery was eliminative in nature, but it has also been used as an attempt to restore normal function. Examples are found in current treatments for Parkinson’s disease, a movement disorder resulting from basal ganglia dysfunction. Although the standard treatment is medication, the efficacy of the drugs can change over time and even produce debilitating side effects. Some patients who develop severe side effects are now treated surgically. One widely used technique is deep-brain stimulation (DBS), in which electrodes are implanted in the basal ganglia. These devices produce continuous electrical signals that stimulate neural activity. Dramatic and sustained improvements are observed in many patients (Hamani et al., 2006; Krack et al., 1998), although why the procedure works is not well understood. There are side effects, in part because more than one type of neuron is stimulated. Optogenetics methods promise to provide an alternative method in which clinicians can control neural activity. While there are currently no human applications, this method has been used to explore treatments of Parkinson’s symptoms in a mouse model of the disease. Early work here suggests that the most effective treatments may not result from the stimulation of specific cells, but rather the way in which stimulation changes the interactions between different types of cells (Kravitz et al., 2010). This finding underscores that many diseases of the nervous system are not usually related to problems with neurons per se, but rather with how the flow of information is altered by the disease process.
TAKE-HOME MESSAGES
- Research involving patients with neurological disorders is used to examine structure–function relationships. Single and double dissociations can provide evidence that damage to a particular brain region may result in a selective deficit of a certain cognitive operation.
- Surgical procedures have been used to treat neurological disorders such as epilepsy or Parkinson’s disease. Studies conducted in patients before and after surgery have provided unique opportunities to study brainbehavior relationships.
Methods to Perturb Neural Function
As mentioned earlier, patient research rests on the assumption that brain injury is an eliminative process. The lesion is believed to disrupt certain mental operations while having little or no impact on others. The brain is massively interconnected, however, so just as with lesion studies in animals, structural damage in one area might have widespread functional (i.e., behavioral) consequences; or, through disruption of neural connections, the functional impact might be associated with a region of the brain that was not itself directly damaged. There is also increasing evidence that the brain is a plastic device: Neural function is constantly being reshaped by our experiences, and such reorganization can be quite remarkable following neurological damage. Consequently, it is not always easy to analyze the function of a missing part by looking at the operation of the remaining system. You don’t have to be an auto mechanic to understand that cutting the spark plug wires or cutting the gas line will cause an automobile to stop running, but this does not mean that spark plug wires and the gas line do the same thing; rather, removing either one of these parts has similar functional consequences.
Many insights can be gleaned from careful observations of people with neurological disorders, but as we will see throughout this book, such methods are, in essence, correlational. Concerns like these point to the need for methods that involve the study of the normal brain.
The neurologically intact participant, both human and nonhuman, is used, as we have already noted, as a control when studying participants with brain injuries. Neurologically intact participants are also used to study intact function (discussed later in this chapter) and to investigate the effects of transient perturbations to the normal brain, which we discuss next.
One age-old method of perturbing function in both humans and animals is one you may have tried yourself: the use of drugs, whether it be coffee, chocolate, beer, or something stronger. Newer methods include transcranial magnetic stimulation and transcranial direct current stimulation. Genetic methods, used in animal models, provide windows into the molecular mechanisms that underpin brain function. Genomic analysis can also help identify the genetic abnormalities that contribute to certain diseases, such as Huntington’s. And of course, optogenetics, which opened this chapter, has enormous potential for understanding brain structure–function connections as well as managing or curing some devastating diseases.
We turn now to the methods used to perturb function, both at the neurologic and genetic levels, in normal participants.
Pharmacology
The release of neurotransmitters at neuronal synapses and the resultant responses are critical for information transfer from one neuron to the next. Though protected by the blood–brain barrier (BBB), the brain is not a locked compartment. Many different drugs, known as psychoactive drugs (e.g., caffeine, alcohol, and cocaine as well as the pharmaceutical drugs used to treat depression and anxiety), can disturb these interactions, resulting in changes in cognitive function. Pharmacological studies may involve the administration of agonist drugs, those that have a similar structure to a neurotransmitter and mimic its action, or antagonist drugs, those that bind to receptors and block or dampen neurotransmission.
For the researcher studying the impacts of pharmaceuticals on human populations, there are “native” groups to study, given the prevalence of drug use in our culture. For example, in Chapter 12 we examine studies of cognitive impairments associated with chronic cocaine abuse.
Besides being used in studies of chronic drug users, neurologically intact populations are used for studies in which researchers administer a drug in a controlled environment and monitor its effects on cognitive function. For instance, the neurotransmitter dopamine is known to be a key ingredient in reward-seeking behavior. One study looked at the effect of dopamine on decision making when a potential monetary reward or loss was involved. One group of participants received the dopamine receptor antagonist haloperidol; another received the receptor agonist L-DOPA, the metabolic precursor of dopamine (though dopamine itself is unable to cross the BBB, L-DOPA can and is then converted to dopamine). Each group performed a computerized learning task, in which they were presented with a choice of two symbols on each trial. They had to choose between the symbols with the goal of maximizing payoffs (Figure 3.12; Pessiglione et al., 2006). Each symbol was associated with a certain unknown probability of gain or no gain, loss or no loss, or no gain or loss. For instance, a squiggle stood an 80 % chance of winning a pound and a 20 % chance of winning nothing, but a figure eight stood an 80 % of losing a pound and a 20 % chance of no loss, and a circular arrow resulted in no win or loss. On gain trials, the L-DOPA-treated group won more money than the haloperidol-treated group, whereas on loss trials, the groups did not differ. These results are consistent with the hypothesis that dopamine has a selective effect on reward-driven learning.
A major drawback of drug studies in which the drug is injected into the bloodstream is the lack of specificity. The entire body and brain are awash in the drug, so it is unknown how much drug actually makes it to the site of interest in the brain. In addition, the potential impact of the drug on other sites in the body and the dilution effect confound data analysis. In some animal studies, direct injection of a study drug to specific brain regions helps obviate this problem. For example, Judith Schweimer (2006) examined the brain mechanisms involved in deciding how much effort an individual should expend to gain a reward. Do you stay on the couch and watch a favorite TV show, or get dressed up to go out to a party and perhaps make a new friend? Earlier work showed that rats depleted of dopamine are unwilling to make effortful responses that are highly rewarding (Schweimer et al., 2005) and that the anterior cingulate cortex (ACC), a part of the prefrontal cortex, is important for evaluating the cost versus benefit of performing an action (Rushworth et al., 2004). Knowing that there are two types of dopamine receptors in the ACC, called D1 and D2, Schweimer wondered which was involved. In one group of rats, she injected a drug into the ACC that blocked the D1 receptor; in another, she injected a D2 antagonist. The group that had their D1 receptors blocked turned out to act like couch potatoes, but the rats with blocked D2 receptors were willing to make the effort to pursue the high reward. This dissociation indicates that dopamine input to the D1 receptors within the ACC is critical for effort-based decision making.
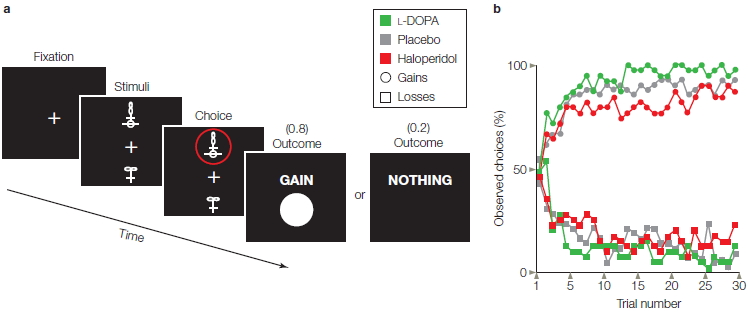
FIGURE 3.12 Pharmacological manipulation of reward-based learning.
(a) Participants chose the upper or lower of two abstract visual stimuli and observed the outcome. The selected stimulus, circled in red, is associated with an 80% chance of winning $1 and a 20% chance of winning nothing. The probabilities are different for other stimuli. (b) Learning functions showing probability of selecting stimuli associated with gains (circles) or avoid stimuli associated with losses (squares) as a function of the number of times each stimulus was presented. Participants given L-DOPA (green), a dopamine agonist, were faster in learning to choose stimuli associated with gains, compared to participants given a placebo (gray). Participants given haloperidol (red), a dopamine antagonist, were slower in leaning to choose the gain stimuli. The drugs did not affect how quickly participants learned to avoid the stimuli associated with a cost.
Transcranial Magnetic Stimulation
Transcranial magnetic stimulation (TMS) offers a method to noninvasively produce focal stimulation of the human brain. The TMS device consists of a tightly wrapped wire coil, encased in an insulated sheath and connected to a source of powerful electrical capacitors. Triggering the capacitors sends a large electrical current through the coil, generating a magnetic field. When the coil is placed on the surface of the skull, the magnetic field passes through the skin and scalp and induces a physiological current that causes neurons to fire (Figure 3.13a). The exact mechanism causing the neural discharge is not well understood. Perhaps the current leads to the generation of action potentials in the soma; alternatively, the current may directly stimulate axons. The area of neural activation will depend on the shape and positioning of the coil. With currently available coils, the area of primary activation can be constrained to about 1.0 to 1.5 cm3, although there are also downstream effects (see Figure 3.13b).
When the TMS coil is placed over the hand area of the motor cortex, stimulation will activate the muscles of the wrist and fingers. The sensation can be rather bizarre. The hand visibly twitches, yet the participant is aware that the movement is completely involuntary! Like many research tools, TMS was originally developed for clinical purposes. Direct stimulation of the motor cortex provides a relatively simple way to assess the integrity of motor pathways because muscle activity in the periphery can be detected about 20 milliseconds (ms) after stimulation.
TMS has also become a valuable research tool in cognitive neuroscience because of its ability to induce “virtual lesions” (Pascual-Leone et al., 1999). By stimulating the brain, the experimenter is disrupting normal activity in a selected region of the cortex. Similar to the logic in lesion studies, the behavioral consequences of the stimulation are used to shed light on the normal function of the disrupted tissue. This method is appealing because the technique, when properly conducted, is safe and noninvasive, producing only a relatively brief alteration in neural activity. Thus, performance can be compared between stimulated and nonstimulated conditions in the same individual. This, of course, is not possible with brain-injured patients.
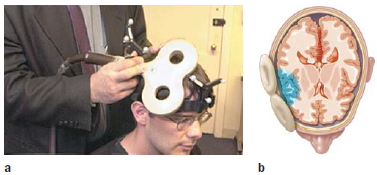
FIGURE 3.13 Transcranial magnetic stimulation.
(a) The TMS coil is held by the experimenter against the participant’s head. Both the coil and the participant have affixed to them a tracking device to monitor the head and coil position in real time. (b) The TMS pulse directly alters neural activity in a spherical area of approximately 1 cm3.
The virtual-lesion approach has been successfully employed even when the person is unaware of any effects from the stimulation. For example, stimulation over visual cortex (Figure 3.14) can interfere with a person’s ability to identify a letter (Corthout et al., 1999). The synchronized discharge of the underlying visual neurons interferes with their normal operation. The timing between the onset of the TMS pulse and the onset of the stimulus (e.g., presentation of a letter) can be manipulated to plot the time course of processing. In the letter identification task, the person will err only if the stimulation occurs between 70 and 130 ms after presentation of the letter. If the TMS is given before this interval, the neurons have time to recover; if the TMS is given after this interval, the visual neurons have already responded to the stimulus.
Transcranial Direct Current Stimulation
Transcranial direct current stimulation (tDCS) is a brain stimulation procedure that has been around in some form for the last two thousand years. The early Greeks and Romans used electric torpedo fish, which can deliver from 8 to 220 volts of DC electricity, to stun and numb patients in an attempt to alleviate pain, such as during childbirth and migraine headache episodes. Today’s electrical stimulation uses a much smaller current (1–2 mV) that feels like a tingling or itchy feeling when it is turned on or off. tDCS sends a current between two small electrodes—an anode and a cathode—placed on the scalp. Physiological studies show that neurons under the anode become depolarized. That is, they are put into an elevated state of excitability, making them more likely to initiate an action potential when a stimulus or movement occurs (see Chapter 2). Neurons under the cathode become hyperpolarized and are less likely to fire. tDCS will alter neural activity over a much larger area than is directly affected by a TMS pulse.
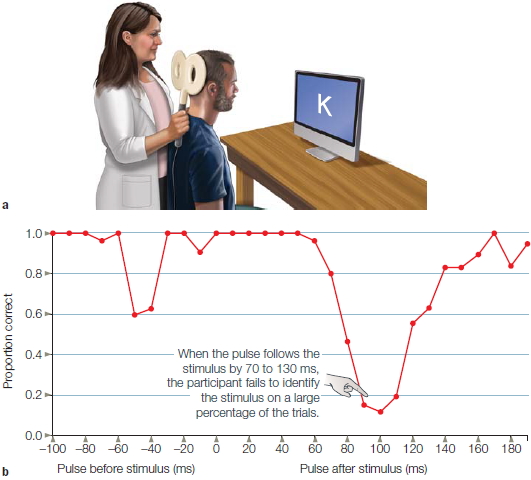
FIGURE 3.14 Transcranial magnetic stimulation over the occipital lobe.
(a) The center of the coil is positioned over the occipital lobe to disrupt visual processing. The participant attempts to name letters that are briefly presented on the screen. A TMS pulse is applied on some trials, either just before or just after the letter. (b) The independent variable is the time between the TMS pulse and letter presentation. Visual perception is markedly disrupted when the pulse occurs 80–120 ms after the letter due to disruption of neural activity in the visual cortex. There is also a drop in performance if the pulse comes before the letter. This is likely an artifact due to the participant blinking in response to the sound of the TMS pulse.
tDCS has been shown to produce changes in behavioral performance. The effects can sometimes be observed within a single experimental session. Anodal tDCS generally leads to improvements in performance, perhaps because the neurons are put into a more excitable state. Cathodal stimulation may hinder performance, akin to TMS, although the effects of cathodal stimulation are generally less consistent. tDCS has also been shown to produce beneficial effects for patients with various neurological conditions such as stroke or chronic pain. The effects tend to be short-lived, lasting for just a half hour beyond the stimulation phase. If repeatedly applied, however, the duration of the benefit can be prolonged from minutes to weeks (Boggio et al., 2007).
TMS and tDCS give cognitive neuroscientists safe methods for transiently disrupting the activity of the human brain. An appealing feature of these methods is that researchers can design experiments to test specific functional hypotheses. Unlike neuropsychological studies in which comparisons are usually between a patient group and matched controls, participants in TMS and tDCS studies can serve as their own controls, since the effects of these stimulation procedures are transient.
Genetic Manipulations
The start of the 21st century witnessed the climax of one of the great scientific challenges: the mapping of the human genome. Scientists now possess a complete record of the genetic sequence on our chromosomes. We have only begun to understand how these genes code for all aspects of human structure and function. In essence, we now have a map containing the secrets to many treasures: What causes people to grow old? Why are some people more susceptible to certain cancers than other people? What dictates whether embryonic tissue will become a skin cell or a brain cell? Deciphering this map is an imposing task that will take years of intensive study.
Genetic disorders are manifest in all aspects of life, including brain function. As noted earlier, diseases such as Huntington’s disease are clearly heritable. By analyzing individuals’ genetic codes, scientists can now predict whether the children of individuals carrying the HD gene will develop this debilitating disorder. Moreover, by identifying the genetic locus of this disorder, scientists hope to devise techniques to alter the aberrant genes, either by modifying them or by figuring out a way to prevent them from being expressed.
In a similar way, scientists have sought to understand other aspects of normal and abnormal brain function through the study of genetics. Behavioral geneticists have long known that many aspects of cognitive function are heritable. For example, controlling mating patterns on the basis of spatial-learning performance allows the development of “maze-bright” and “maze-dull” strains of rats. Rats that quickly learn to navigate mazes are likely to have offspring with similar abilities, even if the offspring are raised by rats that are slow to navigate the same mazes. Such correlations are also observed across a range of human behaviors, including spatial reasoning, reading speed, and even preferences in watching television (Plomin et al., 1990). This finding should not be taken to mean that our intelligence or behavior is genetically determined. Maze-bright rats perform quite poorly if raised in an impoverished environment. The truth surely reflects complex interactions between the environment and genetics (see “The Cognitive Neuroscientist’s Toolkit: Correlation and Causation”).
To understand the genetic component of this equation, neuroscientists are now working with many animal models, seeking to identify the genetic mechanisms of both brain structure and function. Dramatic advances have been made in studies with model organisms like the fruit fly and mouse, two species with reproductive propensities that allow many generations to be spawned in a relatively short time. As with humans, the genomes for these species have been sequenced, which has provided researchers the opportunity to explore the functional role of many genes. A key methodology is to develop genetically altered animals, using what are referred to as knockout procedures. The term knockout comes from the fact that specific genes have been manipulated so that they are no longer present or expressed. Scientists can then study the knockout strains to explore the consequences of these changes. For example, weaver mice are a knockout strain in which Purkinje cells, the prominent cell type in the cerebellum, fail to develop. As the name implies, these mice exhibit coordination problems.
At an even more focal level, knockout procedures have been used to create strains that lack a single type of postsynaptic receptor in specific brain regions, while leaving intact other types of receptors. Susumu Tonegawa at the Massachusetts Institute of Technology (MIT) and his colleagues developed a mouse strain in which N-methyl-D-aspartate (NMDA) receptors were absent in cells within a subregion of the hippocampus (Wilson & Tonegawa, 1997; also see Chapter 9). Mice lacking these receptors exhibited poor learning on a variety of memory tasks, providing a novel approach for linking memory with its molecular substrate (Figure 3.15). In a sense, this approach constitutes a lesion method, but at a microscopic level.

FIGURE 3.15 Fear conditioning in knockout mice.
Brain slices through the hippocampus, showing the absence of a particular receptor in genetically altered mice (CTX = cortex; DG = dentate gyrus; ST = striatum). (a) Cells containing the gene associated with the receptor are stained in black. (b) These cells are absent in the CA1 region of the slice from the knockout mouse. (c) Fear conditioning is impaired in knockout mice. After receiving a shock, the mice freeze. When normal mice are placed in the same context 24 hours later, they show strong learning by the large increase in the percentage of freezing responses. This increase is reduced in the knockout mice.
Neurogenetic research is not limited to identifying the role of each gene individually. Complex brain function and behavior arise from interactions between many genes and the environment. As our genetic tools become more sophisticated, scientists will be better positioned to detect the polygenetic influences on brain function and behavior.
TAKE-HOME MESSAGES
- Brain function can be perturbed by drugs, magnetic or electrical stimulation, and through genetic manipulations.
- A major drawback of drug studies, in which the drug is injected into the bloodstream, is the lack of specificity.
- Transcranial magnetic stimulation (TMS) uses magnetic pulses to transiently alter local brain physiology.
- Gene knockout technology allows scientists to explore the consequences of the lack of expression of a specific gene in order to determine its role in behavior.
Structural Analysis of the Brain
We now turn to the methods used to analyze brain structure. Structural methods take advantage of the differences in physical properties that different tissues possess. For instance, when you look at an X-ray, the first thing you notice is that bones appear starkly white and the surrounding structures vary in intensity from black to white. The density of biological material varies, and the absorption of X-ray radiation is correlated with tissue density. In this section, we introduce computed tomography (CT), magnetic resonance imaging (MRI), and diffusion tensor imaging (DTI).
Computed Tomography
Computed tomography (CT or CAT scanning), introduced commercially in 1983, has been an extremely important medical tool for structural imaging of neurological damage in patients.
While conventional X-rays compress three-dimensional objects into two dimensions, CT scanning allows for the reconstruction of three-dimensional space from compressed two-dimensional images. Figure 3.16a depicts the method, showing how X-ray beams are passed through the head and a two-dimensional (2-D) image is generated by sophisticated computer software. The sides of the CT scanner rotate, X-ray beams are sequentially projected, and 2-D images are collected over a 180° arc. Finally, a computer constructs a three-dimensional X-ray image from the series of 2-D images.

FIGURE 3.16 Computed tomography provides an important tool for imaging neurological pathology.
As with standard clinical X-rays, the absorption of X-ray radiation in a CT scan is correlated with tissue density. High-density material, such as bone, absorbs a lot of radiation and appears white. Low-density material, such as air or cerebrospinal fluid, absorbs little radiation. The absorption capacity of neural tissue lies between these extremes. (a) The CT process is based on the same principles as X-rays. An X-ray is projected through the head, and the recorded image provides a measurement of the density of the intervening tissue. By projecting the X-ray from multiple angles combined with the use of computer algorithms, a three-dimensional image based on tissue density is obtained. (b) In this transverse CT image, the dark regions along the midline are the ventricles, the reservoirs of cerebrospinal fluid.
Figure 3.16b shows a CT scan of a healthy individual. Most of the cortex and white matter appear as homogeneous gray areas. The typical spatial resolution for CT scanners is approximately 0.5 to 1.0 cm in all directions. Each point on the image reflects an average density of that point and the surrounding 1.0 mm of tissue. Thus, it is not possible to discriminate two objects that are closer than approximately 5 mm. Because the cortex is only 4 mm thick, it is very difficult to see the boundary between white and gray matter on a CT scan. The white and gray matter are also of very similar density, further limiting the ability of this technique to distinguish them. Larger structures, however, can be identified easily. The surrounding skull appears white due to the high density of bone. The ventricles are black owing to the low density of cerebrospinal fluid.
The issue of causation is important to consider in any discussion of scientific observation. Consider a study that examined the relationship between drinking habits and personal income (Peters & Stringham, 2006). Selfreported drinkers earned about 10% more than selfreported abstainers. Those who drank in bars earned an additional 7%. The research team offered the counterintuitive conclusion that the increase in alcohol consumption played a causative role in the higher income levels, at least in men. In their view, social drinking increases social networking, and this networking has the benefit of increasing income. Although this causal chain is reasonable, there are certainly alternative ways to account for the relationship between drinking and income. For example, individuals who make a lot of money can afford to go to bars at night and spend their income on drinks. In elementary statistics courses, we learn to be wary about inferring causation from correlation, but the temptation can be strong.
The tendency to infer causation from correlation can be especially great when we’re comparing the contribution of nature and nurture to brain and behavior. A good example comes from work examining the relationship of chronic stress and the hippocampus, a part of the brain that is critical for learning and memory. From animal studies, we know that exposure to prolonged stress, and the resulting increase in glucocorticoid steroids, can cause atrophy in the hippocampus (Sapolsky et al., 1990). With the advent of neuroimaging, we have also learned that people with chronic posttraumatic stress disorder (PTSD) have smaller hippocampi then individuals who do not suffer from PTSD (Bremner et al., 1997; M. B. Stein et al., 1997). Can we therefore conclude that the stress that we know is associated with PTSD results, over time, in a reduction in the hippocampal volume of people with PTSD? This certainly seems a reasonable way to deduce a causal chain of events between these observations.
It is also important, however, to consider alternative explanations. For instance, the causal story may run in the opposite direction: Individuals with smaller hippocampi, perhaps due to genetic variation, may be more vulnerable to the effects of stress, and thus be at higher risk for developing PTSD. What study design could distinguish between two hypotheses—one that emphasizes environmental factors (e.g., PTSD, via chronic stress, causes reduction in size of the hippocampus) and one that emphasizes genetic factors (e.g., individuals with small hippocampi are at risk for developing PTSD)?
A favorite approach of behavioral geneticists in exploring questions like these is to study identical twins. Mark Gilbertson and his colleagues (2002) at the New Hampshire Veterans Administration Medical Center studied a cohort of 40 pairs of identical twins. Within each twin pair, one member had experienced severe trauma during a tour of duty in Vietnam. The other member of the pair had not seen active duty. In this way, each high-stress participant had a very well-matched control, at least in terms of genetics: an identical twin brother.
Although all of the active-duty participants had experienced severe trauma during their time in Vietnam (one of the inclusion criteria for the study), not all of these individuals had developed PTSD. Thus, the experimenters could look at various factors associated with the onset of PTSD in a group of individuals with similar environmental experiences. Consistent with previous studies, anatomical MRIs showed that people with PTSD had smaller hippocampi than unrelated individuals without PTSD had. The same was also found for the twin brothers of the individuals with PTSD; that is, these individuals also had smaller hippocampi, even though they did not have PTSD and did not report having experienced unusual trauma in their lifetime. Moreover, the severity of the PTSD was negatively correlated with the size of the hippocampus in both the patient with PTSD (Figure 1a) and the matched twin control (Figure 1b). Thus, the researchers concluded that small hippocampal size was a risk factor for developing PTSD and that PTSD alone did not cause the decreased hippocampal size.
This study serves as an example of the need for caution: Experimenters must be careful when making causal inferences based on correlational data. This study also provides an excellent example of how scientists are studying interactions between genes and the environment in influencing behavior and brain structure.
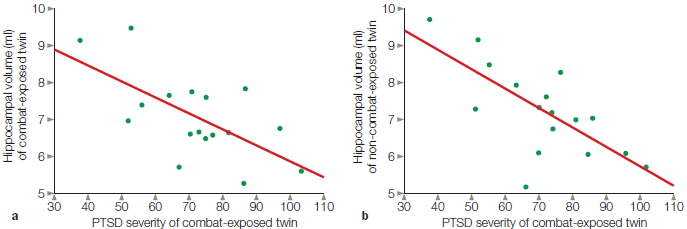
FIGURE 1 Exploring the relationship between PTSD and hippocampal size.
Scatter plots illustrate the relationship of symptom severity in combat veterans with PTSD to (a) their own hippocampal volumes and (b) the hippocampal volumes of their identical twin brothers who were not exposed to combat. Symptom severity represents the total score received on the Clinician-Administered PTSD Scale (CAPS).
Magnetic Resonance Imaging
Although CT machines are still widely used, many hospitals now also own a magnetic resonance imaging (MRI) scanner, which can produce high-resolution images of soft tissue. MRI exploits the magnetic properties of atoms that make up organic tissue. One such atom that is pervasive in the brain, and indeed in all organic tissue, is hydrogen. The proton in a hydrogen atom is in constant motion, spinning about its principal axis. This motion creates a tiny magnetic field. In their normal state, the orientation of a population of protons in tissue is randomly distributed, unaffected by the weak magnetic field created by Earth’s gravity (Figure 3.17). The MRI scanner creates a powerful magnetic field, measured in tesla units. Whereas gravitational forces on the Earth create a magnetic field of about 0.001 tesla, the typical MRI scanner produces a magnetic field from 0.5 to 1.5 teslas. When a person is placed within the magnetic field of the MRI machine, a significant proportion of their protons become oriented in the direction parallel to the strong magnetic force of the MRI machine. Radio waves are then passed through the magnetized regions, and as the protons absorb the energy in these waves, their orientation is perturbed in a predictable direction. When the radio waves are turned off, the absorbed energy is dissipated and the protons rebound toward the orientation of the magnetic field. This synchronized rebound produces energy signals that are picked up by detectors surrounding the head of the participant. By systematically measuring the signals throughout the three-dimensional volume of the head, an MRI system can then construct an image based on the distribution of the protons and other magnetic agents in the tissue. The hydrogen proton distribution is determined largely by the distribution of water throughout the brain, enabling MRI to distinguish clearly the brain’s gray matter, white matter, ventricles, and fiber tracts.
As Figure 3.17b shows, MRI scans provide a much clearer image of the brain than is possible with CT scans. This improvement occurs because the density of protons is much greater in gray matter compared to white matter. With MRI, it is easy to see the individual sulci and gyri of the cerebral cortex. A sagittal section at the midline reveals the impressive size of the corpus callosum. The MRI scans can resolve structures that are much smaller than 1 mm, allowing elegant views of small, subcortical structures such as the mammillary bodies or superior colliculus.
Diffusion Tensor Imaging
A variant of traditional MRI scanners is now used to study the anatomical structure of the axon tracts that form the brain’s white matter; that is, it can offer information about anatomical connectivity between regions. This method, called diffusion tensor imaging (DTI), is performed with an MRI scanner that measures the density and the motion of the water contained in the axons. DTI uses the known diffusion characteristics of water to determine the boundaries that restrict water movement throughout the brain (Behrens et al., 2003). Free diffusion of water is isotropic; that is, it occurs equally in all directions. Diffusion of water in the brain, however, is anisotropic, or restricted, so it does not diffuse equally in all directions. The reason for this anisotropy is that the axon membranes restrict the diffusion of water; the probability of water moving in the direction of the axon is thus greater than the probability of water moving perpendicular to the axon (Le Bihan, 2003). Within the brain, this anisotropy is greatest in axons because myelin creates a nearly pure lipid boundary, which limits the flow of water much more than gray matter or cerebrospinal fluid does. In this way, the orientation of axon bundles within the white matter can be imaged (DaSilva et al., 2003).
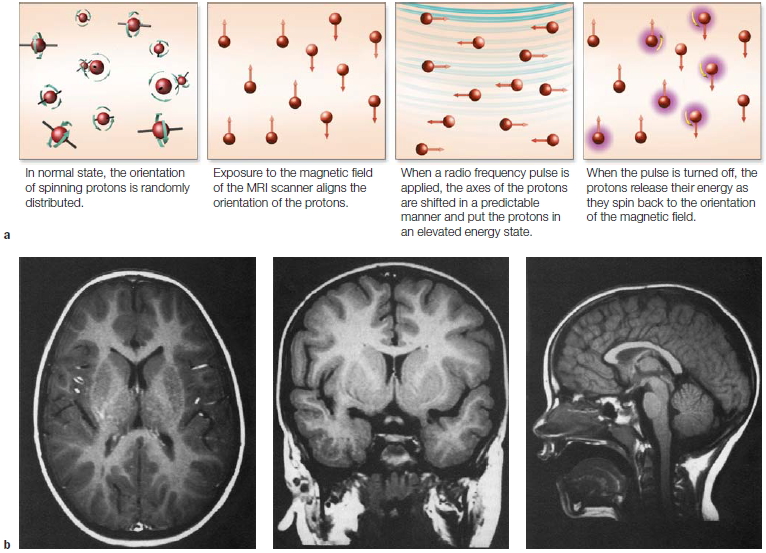
FIGURE 3.17 MRI.
Magnetic resonance imaging exploits the fact that many organic elements, such as hydrogen, are magnetic. (a) In their normal state, the orientation of these hydrogen atom nuclei (i.e., protons) is random. When an external magnetic field is applied, the protons align their axis of spin in the direction of the magnetic field. A pulse of radio waves (RF) alters the spin of the protons as they absorb some of the RF energy. When the RF pulse is turned off, the protons emit their own RF energy, which is detected by the MRI machine. The density of hydrogen atoms is different in white and gray matter, making it easy to visualize these regions. (b) Transverse, coronal, and sagittal images. Comparing the transverse slice in this figure with the CT image in Figure 3.16 reveals the finer resolution offered by MRI. Both images are from about the same level of the brain.
MRI principles can be combined with what is known about the diffusion of water to determine the diffusion anisotropy within the MRI scan. By introducing two large pulses to the magnetic field, MRI signals can be made sensitive to the diffusion of water (Le Bihan, 2003). The first pulse determines the initial position of the protons carried by water. The second pulse, introduced after a short delay, detects how far the protons have moved in space in the specific direction being measured. Since the flow of water is constrained by the axons, the resulting image reveals the major white matter tracts (Figure 3.18).
FIGURE 3.18 Diffusion tensor imaging.
(a) This axial slice of a human brain reveals the directionality and connectivity of the white matter. The colors correspond to the principal directions of the white matter tracts in each region. (b) DTI data can be analyzed to trace white matter connections in the brain. The tracts shown here form the inferior fronto-occipital fasciculus, which, as the name suggests, connects the visual cortex to the frontal lobe.
|
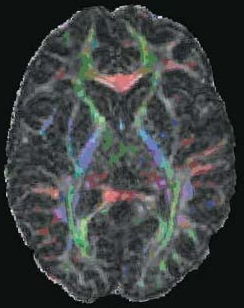
|
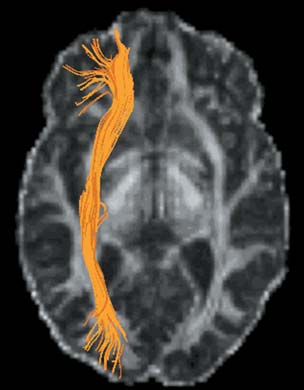
|
|
a
|
b
|
TAKE-HOME MESSAGES
- Computed tomography (CT or CAT) uses X-rays to image the 3-D structure of the brain.
- Magnetic resonance imaging (MRI) exploits the magnetic properties of the organic tissue of the brain to image its structure. The spatial resolution of MRI is superior to CT.
- Diffusion tensor imaging (DTI), performed with magnetic resonance scanners, is used to measure white matter pathways in the brain and thus can offer information about anatomical connectivity between regions.
Methods for the Study of Neural Function
The development of electrodes and recording systems that can measure the electrical activity within a single neuron or from a small group of neurons was a turning point for neurophysiology and related fields. We open this section with a brief discussion of the single-cell recording method and provide some examples of how it is used to understand cognitive functions. We then turn to the blossoming number of methods used to study brain function during cognitive processing. In this section, we introduce some of the technologies that allow researchers to directly observe the electrical activity of the healthy brain in vivo. After that, we turn to methods that measure physiological changes resulting from neural activity and, in particular, changes in blood flow and oxygen utilization that arise when neural activity increases.
Single-Cell Recording in Animals
The most important technological advance in neurophysiology—perhaps in all of neuroscience—was the development of methods to record the activity of single neurons in laboratory animals. With these methods, the understanding of neural activity advanced by a quantum leap. No longer did the neuroscientist have to be content with describing nervous system action in terms of functional regions. Single-cell recording enabled researchers to describe the response characteristics of individual elements.
In single-cell recording, a thin electrode is inserted into an animal’s brain. When the electrode is in the vicinity of a neuronal membrane, changes in electrical activity can be measured (see Chapter 2). Although the surest way to guarantee that the electrode records the activity of a single cell is to record intracellularly, this technique is difficult, and penetrating the membrane frequently damages the cell. Thus single-cell recording is typically done extracellularly, with the electrode situated on the outside of the neuron. There is no guarantee, however, that the changes in electrical potential at the electrode tip reflect the activity of a single neuron. More likely, the tip will record the activity of a small set of neurons. Computer algorithms are subsequently used to differentiate this pooled activity into the contributions from individual neurons.
The neurophysiologist is interested in what causes change in the synaptic activity of a neuron. She seeks to determine the response characteristics of individual neurons by correlating their activity with a given stimulus pattern or behavior. The primary goal of single-cell recording experiments is to determine what experimental manipulations produce a consistent change in the response rate of an isolated cell. For instance, does the cell increase its firing rate when the animal moves its arm? If so, is this change specific to movements in a particular direction? Does the firing rate for that movement depend on the outcome of the action (e.g., a food morsel to be reached or an itch to be scratched)? Equally interesting, what makes the cell decrease its response rate? These measurements of changes are made against a backdrop of activity, given that neurons are constantly firing even in the absence of stimulation or movement. This baseline activity varies widely from one brain area to another. For example, some cells within the basal ganglia have spontaneous firing rates of over 100 spikes per second, whereas cells in another basal ganglia region have a baseline rate of only 1 spike per second. Further confounding the analysis of the experimental measurements, these spontaneous firing levels fluctuate.
The data from single-cell recording studies is commonly graphed as a raster plot, which shows action potentials as a function of time (Figure 1). The graph includes data from before the start of the trial, providing a picture of the baseline firing rate of the neuron. The graph then shows changes in firing rate as the stimulus is presented and the animal responds. Each line of a raster plot represents a single trial, and the action potentials are marked as ticks in the column. To give a sense of the average response of the neuron over the course of a trial, the data are summed and presented as a bar graph known as a peristimulus histogram. A histogram allows scientists to visualize the rate and timing of neuronal spike discharges in relation to an external stimulus or event.
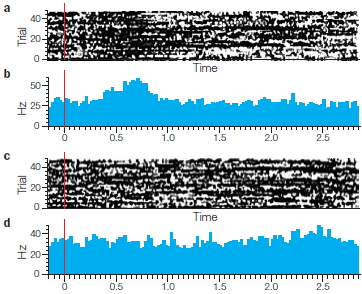
FIGURE 1 Graphing the data from single-cell recording experiments.
Raster plots show the timing of action potentials. It can be called a spike raster, raster plot, or raster graph. Here is a raster plot of a face selective cell during forty different trials presenting either a threatening face (a) or a non face stimulus (c). Stimulus onset is marked by the vertical red line. The trials are plotted on the y-axis and time is plotted on the x-axis. Each dot in the raster plot marks the time of occurrence of a single AP spike. (b) and (d) are histograms.
Single-cell recording has been used in almost all regions of the brain across a wide range of nonhuman species. For sensory neurons, the experimenter might manipulate the input by changing the type of stimulus presented to the animal. For motor neurons, output recordings can be made as the animal performs a task or moves about. Some significant advances in neurophysiology have come about recently as researchers probe higher brain centers to examine changes in cellular activity related to goals, emotions, and rewards.
In a typical experiment, recordings are obtained from a series of cells in a targeted area of interest. Thus a functional map can describe similarities and differences between neurons in a specified cortical region. One area where the single-cell method has been used extensively is the study of the visual system of primates. In a typical experiment, the researcher targets the electrode to a cortical area that contains cells thought to respond to visual stimulation. Once a cell has been identified, the researcher tries to characterize its response properties.
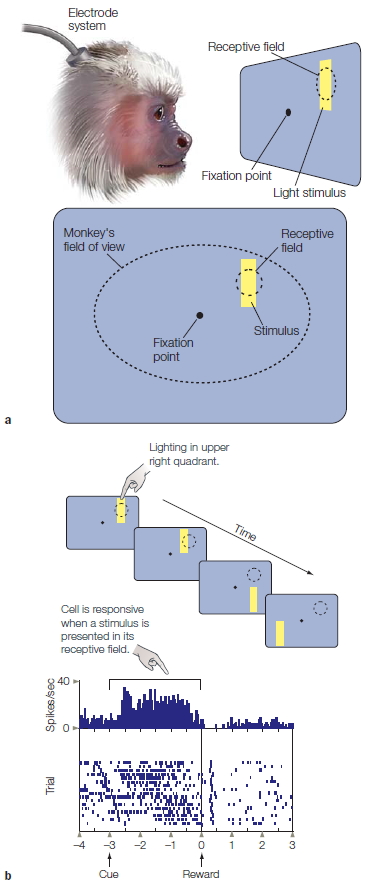
FIGURE 3.19 Electrophysiological methods are used to identify the response characteristics of cells in the visual cortex.
(a) While the activity of a single cell is monitored, the monkey is required to maintain fixation, and stimuli are presented at various positions in its field of view. (b) The vertical lines to the right of each stimulus correspond to individual action potentials. The cell fires vigorously when the stimulus is presented in the upper right quadrant, thus defining the upper right as the receptive field for this cell.
A single cell is not responsive to all visual stimuli. A number of stimulus parameters might correlate with the variation in the cell’s firing rate; examples include the shape of the stimulus, its color, and whether it is moving (see Chapter 5). An important factor is the location of the stimulus. As Figure 3.19 shows, all visually sensitive cells respond to stimuli in only a limited region of space. This region of space is referred to as that cell’s receptive field. For example, some neurons respond when the stimulus is located in the lower left portion of the visible field. For other neurons, the stimulus may have to be in the upper right (Figure 3.19b).
Neighboring cells have at least partially overlapping receptive fields. As a region of visually responsive cells is traversed, there is an orderly relation between the receptive-field properties of these cells and the external world. External space is represented in a continuous manner across the cortical surface: Neighboring cells have receptive fields of neighboring regions of external space. As such, cells form a topographic representation, an orderly mapping between an external dimension such as spatial location and the neural representation of that dimension. In vision, topographic representations are referred to as retinotopic. Cell activity within a retinotopic map correlates with the location of the stimulus (Figure 3.20a,b).
There are other types of topographic maps. In Chapter 2, we reviewed the motor and somatosensory maps along the central sulcus that provide topographic representations of the body surface. In a similar sense, auditory areas in the subcortex and cortex contain tonotopic maps, in which the physical dimension reflected in neural organization is the sound frequency of a stimulus. With a tonotopic map, some cells are maximally activated by a 1000-Hz tone and others by a 4000-Hz tone (Figure 3.20c). In addition, neighboring cells tend to be tuned to similar frequencies. Thus, sound frequencies are reflected in cells that are activated upon the presentation of a sound. Tonotopic maps are sometimes referred to as cochleotopic because the cochlea, the sensory apparatus in the ear, contains hair cells tuned to distinct regions of the auditory spectrum.
When the single-cell method was first introduced, neuroscientists had high hopes that the mysteries of brain function would finally be solved. All they needed was a catalog of contributions by different cells. Yet it soon became clear that, with neurons, the aggregate behavior of cells might be more than just the sum of its parts. The function of an area might be better understood by identifying the correlations in the firing patterns of groups of neurons rather than identifying the response properties of each individual neuron. This idea has inspired single-cell physiologists to develop new techniques that allow recordings to be made in many neurons simultaneously—what is called multiunit recording.
Bruce McNaughton and colleagues at the University of Arizona studied how the rat hippocampus represents spatial information by simultaneously recording from 150 cells (Wilson & McNaughton, 1994). By looking at the pattern of activity over the group of neurons, the re searchers were able to show how the rat coded spatial and episodic information differently. Today, it is common to record from over 400 cells simultaneously (Lebedev & Nicolelis, 2006). As we will see in Chapter 8, multiunit recordings from motor areas of the brain are now being used to allow animals to control artificial limbs just by thinking about movement. This dramatic medical advance may change the way rehabilitation programs are designed for paraplegics. For example, multiunit recordings can be obtained while people think about actions they would like to perform, and this information can be analyzed by computers to control robotic or artificial limbs.
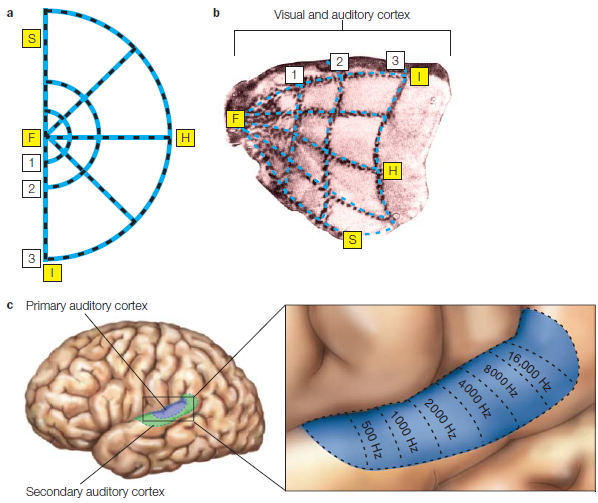
FIGURE 3.20 Topographic maps of the visual and auditory cortex.
In the visual cortex, the receptive fields of the cells define a retinotopic map. While viewing the stimulus (a), a monkey was injected with a radioactive agent. (b) Metabolically active cells in the visual cortex absorb the agent, revealing how the topography of the retina is preserved across the striate cortex. (c) In the auditory cortex, the frequency-tuning properties of the cells define a tonotopic map. Topographic maps are also seen in the somatosensory and motor cortex.
Single-Cell Recordings in Humans
Single-cell recordings from human brains are rare. When surgical procedures are required to treat cases of epilepsy or to remove a tumor, however, intracranial electrodes may be inserted as part of the procedure to localize the abnormality in preparation of the surgical resection. In epilepsy, the electrodes are commonly placed in the medial temporal lobe (MTL), where the focus of generalized seizures is most frequent. Many patients with implanted electrodes have given generously of their time for research purposes, engaging in experimental tasks so that researchers can obtain neurophysiological recordings in humans.
Itzhak Fried and his colleagues have found that MTL neurons in humans can respond selectively to specific familiar images. For instance, in one patient a single neuron in the left posterior hippocampus was activated when presented with different views of the actress Jennifer Aniston but not when presented with images of other well-known known people or places (Quiroga et al., 2005). Another neuron showed an increase in activation when the person viewed images of Halle Berry or read her printed name (Figure 3.21). This neuron corresponds to what we might think of as a conceptual representation, one that is not tied to a particular sensory modality (e.g., vision). Consistent with this idea, cells like these are also activated when the person is asked to imagine Jennifer Aniston or Halle Berry, or to think about movies these actresses have performed in (Cerf et al., 2010).
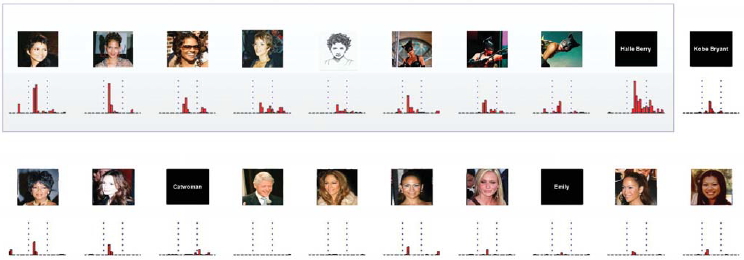
FIGURE 3.21 The Halle Berry neuron?
Recordings were made from a single neuron in the hippocampus of a patient with epilepsy. The cell activity to each picture is shown in the histograms, with the dotted lines indicating the window within which the stimulus was presented. This cell showed prominent activity to Halle Berry stimuli, including photos of her, photos of her as Catwoman, and even her name.
Electroencephalography
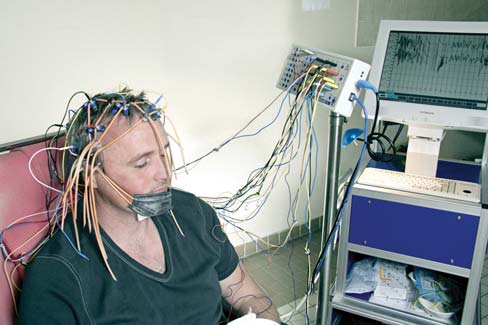
FIGURE 3.22 Person wired up for an EEG study.
Although the electrical potential produced by a single neuron is minute, when populations of neurons are active together, they produce electrical potentials large enough to be measured by non-invasive electrodes that have been placed on the scalp, a method known as electroencephalography (EEG). These surface electrodes, usually 20 to 256 of them embedded in an elastic cap, are much bigger than those used for single-cell recordings (Figure 3.22). The electrical potential can be recorded at the scalp because the tissues of the brain, skull, and scalp passively conduct the electrical currents produced by synaptic activity. The fluctuating voltage at each electrode is compared to the voltage at a reference electrode, which is usually located on the mastoid bone at the base of the skull. The recording from each electrode reflects the electrical activity of the underlying brain region. The record of the signals is referred to as an electroencephalogram.
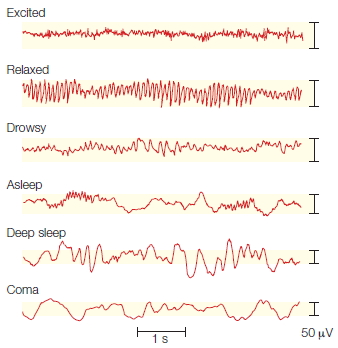
FIGURE 3.23 EEG profiles obtained during various states of consciousness.
Recorded from the scalp, the electrical potential exhibits a waveform with time on the x-axis and voltage on the y-axis. Over time, the waveform oscillates between a positive and negative voltage. Very slow oscillations dominate in deep sleep, or what is called the delta wave. When awake, the oscillations occur much faster when the person is relaxed (alpha) or reflect a combination of many components when the person is excited.
EEG yields a continuous recording of overall brain activity. Because we have come to understand that predictable EEG signatures are associated with different behavioral states, it has proved to have many important clinical applications (Figure 3.23). In deep sleep, for example, the EEG is characterized by slow, high-amplitude oscillations, presumably resulting from rhythmic changes in the activity states of large groups of neurons. In other phases of sleep and in various wakeful states, the pattern changes, but always in a predictable manner. Because normal EEG patterns are well established and consistent among individuals, EEG recordings can be used to detect abnormalities in brain function. For example, EEG provides valuable information in the assessment and treatment of epilepsy (see Figure 3.10b).
ERP graphs show the average of EEG waves time-locked to specific events such as the onset of a stimulus or response. Time is plotted on the x-axis and voltage on the y-axis. The ERP is composed of a series of waves with either positive or negative polarities (see Figure 3.24 for an example). The components of the waveform are named according to its polarity, N for negative and P for positive, and the time the wave appeared after stimulus onset. Thus, a wave tagged N100 is a negative wave that appeared 100 milliseconds after a stimulus. Unfortunately, there are some idiosyncrasies in the literature (see Figure 3.25). Some components are labeled to reflect their order of appearance. Thus, N1 can refer to the first negative peak. Care must also be used when looking at the wave polarity, because some researchers plot negative in the upward direction and others in the downward direction.
Some components of the ERP have been associated with psychological processes:
- After a stimulus, the earliest components are connected with sensory processing and occur within the first 100 ms. This trait has made them an important tool for clinicians evaluating sensory systems.
- Waves that occur 100 ms after the stimulus presentation are no longer solely derived from sensory processing, but are modulated by attention. The N100 and P100 waves are associated with selective attention.
- The N200 wave is known as the mismatch negativity component. It is found when a stimulus is physically deviant from the preceding stimuli, such as when a G tone is heard after a series of C tones.
- The P300 wave is seen when an attended stimulus is presented, especially if the stimulus is relatively rare.
- The N400 component is observed when a stimulus is unexpected. It differs from the N200 in that the surprise event here might be a violation of semantics (e.g., “The cow jumped over the banana”), rather than a physical change.
Event-Related Potential
EEG reveals little about cognitive processes, because the recording tends to reflect the brain’s global electrical activity. Another approach used by many cognitive neuroscientists focuses on how brain activity is modulated in response to a particular task. The method requires extracting an evoked response from the global EEG signal.
The logic of this approach is as follows: EEG traces recorded from a series of trials are averaged together by aligning them relative to an external event, such as the onset of a stimulus or response. This alignment eliminates variations in the brain’s electrical activity that are unrelated to the events of interest. The evoked response, or event-related potential (ERP), is a tiny signal embedded in the ongoing EEG that was triggered by the stimulus. By averaging the traces, investigators can extract this signal, which reflects neural activity that is specifically related to the sensory, motor, or cognitive event that evoked it—hence the name event-related potential (Figure 3.24).
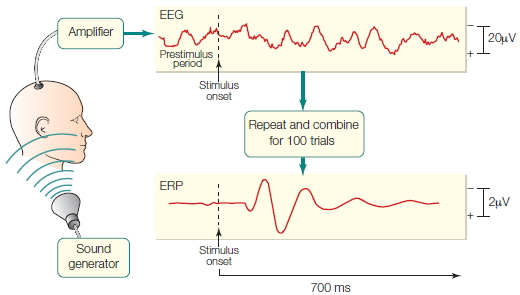
FIGURE 3.24 Recording an ERP.
The relatively small electrical responses to specific events can be observed only if the EEG traces are averaged over a series of trials. The large background oscillations of the EEG trace make it impossible to detect the evoked response to the sensory stimulus from a single trial. Averaging across tens or hundreds of trials, however, removes the background EEG, leaving the event-related potential (ERP). Note the difference in scale between the EEG and ERP waveforms.
ERPs provide an important tool for clinicians. For example, the visual evoked potential can be useful in diagnosing multiple sclerosis, a disorder that leads to demyelination. When demyelination occurs in the optic nerve, the electrical signal does not travel as quickly, and the early peaks of the visual evoked response are delayed in their time of appearance. Similarly, in the auditory system, tumors that compromise hearing by compressing or damaging auditory processing areas can be localized by the use of auditory evoked potentials (AEPs) because characteristic wave peaks and troughs in the AEP are known to arise from neuronal activity in specific anatomic areas of the ascending auditory system. The earliest of these AEP waves indicates activity in the auditory nerve, occurring within just a few milliseconds of the sound. Within the first 20 to 30 ms after the sound, a series of AEP waves indicates, in sequence, neural firing in the brainstem, then midbrain, then thalamus, and finally the cortex (Figure 3.25).
Note that these localization claims are based on indirect methods, because the electrical recordings are actually made on the surface of the scalp. For early components related to the transmission of signals along the sensory pathways, the neural generators are inferred from the findings of other studies that use direct recording techniques as well as considerations of the time required for neural signals to travel. This approach is not possible when researchers look at evoked responses generated by cortical structures. The auditory cortex relays its message to many cortical areas, which all contribute to the measured evoked response, making it much harder to localize these components.
ERPs are thus better suited to addressing questions about the time course of cognition rather than to localizing the brain structures that produce the electrical events. For example, as we will see in Chapter 7, evoked responses can tell us when attention affects how a stimulus is processed. ERPs also provide physiological indices of when a person decides to respond or when an error is detected.

FIGURE 3.25 Measuring auditory evoked potentials.
The evoked potential shows a series of positive (P) and negative (N) peaks at predictable points in time. In this auditory evoked potential, the early peaks are invariant and have been linked to neural activity in specific brain structures. Later peaks are task dependent, and localization of their source has been a subject of much investigation and debate.
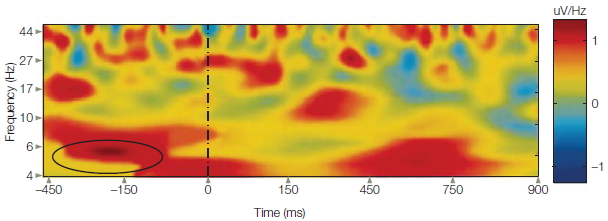
FIGURE 3.26 Time-frequency analysis plot
Stimulus is presented at time 0. The color represents “power,” or the activity (as indicated at the bar on the right, where blue is the lowest activity and red is the highest) of a particular frequency at various times both before and after the stimulus is presented. Alpha rhythm (8–12 Hz; circled lower left) is strong prior to the onset of a stimulus. Following the stimulus, there is a shift in the EEG waveform with increasing power at lower frequencies, as well as higher frequencies (not shown).
Lately, researchers also have been interested in the event-related oscillatory activity in the EEG signal. The waves of the EEG signal represent a number of rhythms, reflecting the synchronized and oscillatory activity of groups of neurons. Presumably, recognizing something requires not only that individual neurons fire but also that they fire in a coherent manner. This coherent firing is what produces the rhythms of the brain. The rhythms are defined by the frequency of the oscillations; thus, alpha refers to frequencies around 10 Hz, or 10 times per second (Figure 3.26). Time-frequency analysis refers to the fact that the amplitude (i.e., power) of a wave in different frequency regions varies over the course of processing. Thus time-frequency analysis is a way to characterize two-dimensional signals that vary in time. Just as with ERP, activity is linked to an event and measured over time; but the strength of the activity in different EEG frequencies is measured, rather than summing the signal of all of the activity.
Magnetoencephalography
A technique related to the ERP method is magnetoencephalography, or MEG. The electrical current associated with synaptic activity produces small magnetic fields that are perpendicular to the current. As with EEG, MEG traces can be recorded and averaged over a series of trials to obtain event-related fields (ERFs). MEG provides the same temporal resolution as with ERPs, but it can be used more reliably to localize the source of the signal. Unlike electrical signals, magnetic fields are not distorted as they pass through the brain, skull, and scalp. Modeling techniques, similar to those used in EEG, are necessary to localize the source of the electrical activity. With MEG data, however, the solutions are more accurate.
Indeed, the reliability of spatial resolution with MEG has made it a useful tool in neurosurgery (Figure 3.27), where it is employed to identify the focus of epileptic seizures and to locate tumors in areas that present a surgical dilemma. For example, learning that a tumor extends into the motor cortex of the precentral sulcus, a surgeon may avoid or delay a procedure if it is likely to damage motor cortex and leave the person with partial paralysis.
MEG has two drawbacks. First, it is able to detect current flow only if that flow is oriented parallel to the surface of the skull. Most cortical MEG signals are produced by intracellular current flowing within the apical dendrites of pyramidal neurons (see Chapter 2). For this reason, the neurons that can be recorded with MEG tend to be located within sulci, where the long axis of each apical dendrite tends to be oriented parallel to the skull surface.
Another problem with MEG stems from the fact that the magnetic fields generated by the brain are extremely weak. To be effective, the MEG device requires a room that is magnetically shielded from all external magnetic fields, including the Earth’s magnetic field. To detect the brain’s weak magnetic fields, the sensors, known as superconducting quantum interference devices (SQUIDS), are encased in large, liquid-helium-containing cylinders that keep them colder than 4 degrees Kelvin.
Electrocortogram
An electrocortogram (ECoG) is similar to an EEG, except that the electrodes are placed directly on the surface of the brain, either outside the dura or beneath it. Thus, ECoG is appropriate only for people who are undergoing neurosurgical treatment. The ECoG recordings provide useful clinical information, allowing the surgical team to monitor brain activity to identify the location and frequency of abnormal brain activity. Since the implants are left in place for a week, there is time to conduct experiments in which the person performs some sort of cognitive task. ECoG electrodes measure electrical signals before they pass through the scalp and skull. Thus, there is far less signal distortion compared with EEG. This much cleaner signal results in excellent spatial and temporal resolution. The electrodes can also be used to stimulate the brain and to map and localize cortical and subcortical neurologic functions, such as motor or language function. Combining seizure data with the knowledge of what structures will be affected by surgery permits a risk–benefit profile of the surgery to be established.
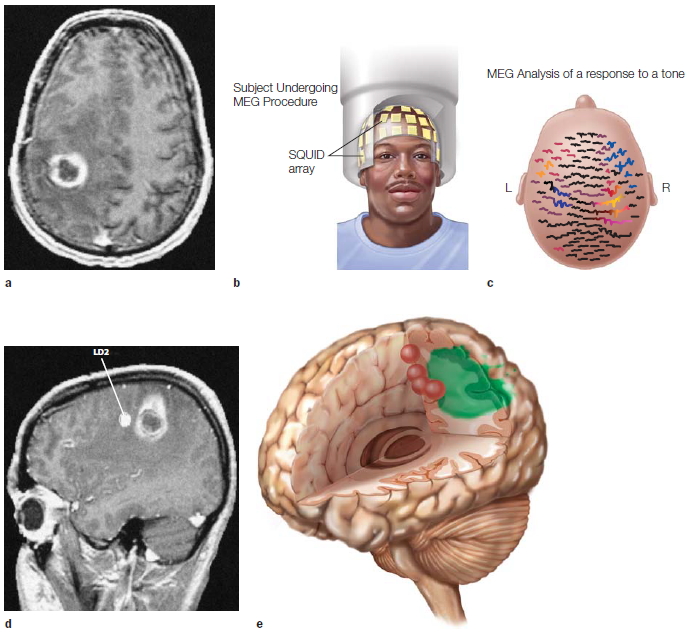
FIGURE 3.27 Magnetoencephalography as a noninvasive presurgical mapping procedure.
(a) This MRI shows a large tumor in the vicinity of the central sulcus. (b) Device used to record MEG showing location of the SQUIDS. (c) These event-related fields (ERFs) were produced following repeated tactile stimulation of the index finger. Each trace shows the magnetic signal recorded from an array of detectors placed over the scalp. (d) Inverse modeling showed that the dipole (indicated by LD2) producing the surface recordings in part (a) was anterior to the lesion. (e) This three-dimensional reconstruction shows stimulation of the fingers and toes on the left side of the body in red and the tumor outlined in green.
ECoG is able to detect high-frequency brain activity, information that is attenuated or distorted in scalp EEG recordings. The experimental question in ECoG studies, however, is frequently dictated by the location of the ECoG grid. For example, Robert Knight and his colleagues (2007) studied patients who had ECoG grids that spanned temporal and frontal regions of the left hemisphere. They monitored the electrical response when people processed words. By examining the signal changes across several frequency bands, the researchers could depict the successive recruitment of different neural regions (Figure 3.28). Shortly (100 ms) after the stimulus was presented, the signal for very high-frequency components of the ECoG signal (high gamma range) increased over temporal cortex. Later on, the activity change was observed over frontal cortex. By comparing trials in which the stimuli were words and trials in which the stimuli were nonsense sounds, the researchers could determine the time course and neural regions involved in distinguishing speech from nonspeech.
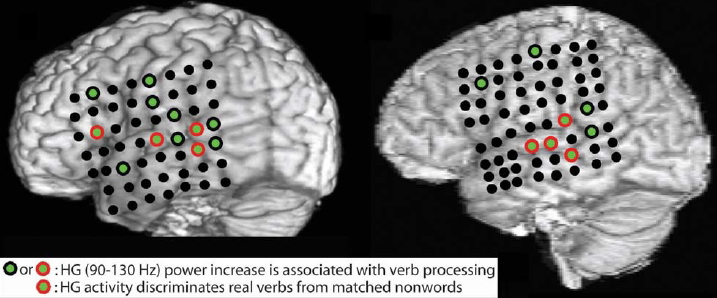
FIGURE 3.28 Structural MRI renderings with electrode locations for four study participants.
Structural MRI images to indicate position of electrode grid on four patients. Electrodes that exhibited an increase in high frequency (gamma) power following the presentation of verbs are shown in green. Red circles indicate electrodes in which the increase in gamma was also observed when the verb condition was compared to acoustically matched nonwords. Verb processing is distributed across cortical areas in the superior temporal cortex and frontal lobe.
TAKE-HOME MESSAGES
- Single-cell recording allows neurophysiologists to record from individual neurons in the animal brain in order to understand how increases and decreases in the activity of neurons correlate with stimulation of one of the senses or behavior.
- With multiunit recording, the activity of hundreds of cells can be recorded at the same time.
- Electroencephalography (EEG) measures the electrical activity of the brain. The EEG signal includes endogenous changes in electrical activity as well as changes triggered by specific events (e.g., stimuli or movements).
- An event-related potential (ERP) is a change in electrical activity that is time-locked to specific events, such as the presentation of a stimulus or the onset of a response. When the events are repeated many times, the relatively small changes in neural activity triggered by these events can be observed by averaging of the EEG signals. In this manner, the background fluctuations in the EEG signal are removed, revealing the event-related signal with great temporal resolution.
- Electrocortogram (ECoG) is similar to an EEG, except that the electrodes are placed directly on the surface of the brain.
- Magnetoencephalography (MEG) measures the magnetic signals generated by the brain. The electrical activity of neurons also produces small magnetic fields, which can be measured by sensitive magnetic detectors placed along the scalp. MEG can be used in an event-related manner similar to ERPs, with similar temporal resolution. The spatial resolution can be superior because magnetic signals are minimally distorted by organic tissue such as the brain or skull.
The Marriage of Function and Structure: Neuroimaging
The most exciting advances for cognitive neuroscience have been provided by imaging techniques that allow researchers to continuously measure physiological changes in the human brain that vary as a function of a person’s perceptions, thoughts, feelings, and actions (Raichle, 1994). The most prominent of these neuroimaging methods are positron emission tomography, commonly referred to as PET, and functional magnetic resonance imaging, or fMRI. These methods detect changes in metabolism or blood flow in the brain while the participant is engaged in cognitive tasks. They enable researchers to identify brain regions that are activated during these tasks and to test hypotheses about functional anatomy.
Unlike EEG and MEG, PET and fMRI do not directly measure neural events. Rather, they measure metabolic changes correlated with neural activity. Like all cells of the human body, neurons require oxygen and glucose to generate the energy to sustain their cellular integrity and perform their specialized functions. As with all other parts of the body, oxygen and glucose are distributed to the brain by the circulatory system. The brain is a metabolically demanding organ. The central nervous system uses approximately 20 % of all the oxygen that we breathe. Yet the amount of blood supplied to the brain varies only a little between times when the brain is most active and when it is quiescent. (Perhaps this is so because what we regard as active and inactive in relation to behavior does not correlate with active and quiescent in the context of neural activity.) Thus, the brain must regulate how much or how fast blood flows to different regions depending on need. When a brain area is active, more oxygen and glucose are provided by increasing the blood flow to that active region, at the expense of other parts of the brain.
Positron Emission Tomography
PET activation studies measure local variations in cerebral blood flow that are correlated with mental activity (Figure 3.29). A radioactive substance is introduced into the bloodstream. The radiation emitted from this “tracer” is monitored by the PET instrument. Specifically, the radioactive isotopes within the injected substance rapidly decay by emitting a positron from their atomic nuclei. When a positron collides with an electron, two photons, or gamma rays, are created. The two photons move in opposite directions at the speed of light, passing unimpeded through brain tissue, skull, and scalp. The PET scanner—essentially a gamma ray detector—determines where the collision took place. Because these tracers are in the blood, a reconstructed image shows the distribution of blood flow: Where there is more blood flow, there will be more radiation.
The most common isotope used in cognitive studies is 15O, an unstable form of oxygen with a half-life of 123 seconds. This isotope, in the form of water (H215O), is injected into the bloodstream while a person is engaged in a cognitive task. Although all areas of the body will use some of the radioactive oxygen, the fundamental assumption of PET is that there will be increased blood flow to the brain regions that have heightened neural activity. Thus PET activation studies measure relative activity, not absolute metabolic activity. In a typical PET experiment, the injection of tracer is administered at least twice: during a control condition and during one or more experimental conditions. The results are usually reported as a change in regional cerebral blood flow (rCBF) between the control and experimental conditions.
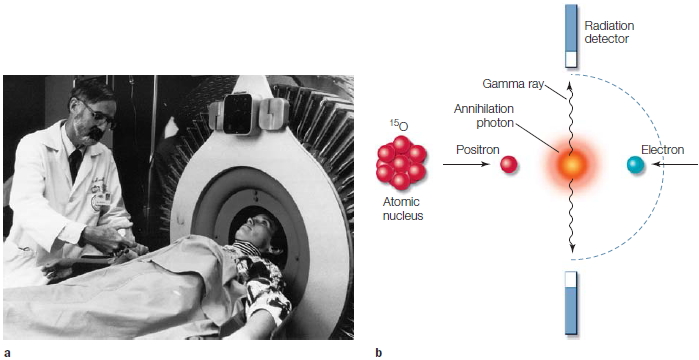
FIGURE 3.29 Positron emission tomography.
(a) PET scanning allows metabolic activity to be measured in the human brain. (b) In the most common form of PET, water labeled with radioactive oxygen, 15O, is injected into the participant. As positrons break off from this unstable isotope, they collide with electrons. A by-product of this collision is the generation of two gamma rays, or photons, that move in opposite directions. The PET scanner measures these photons and calculates their source. Regions of the brain that are most active will increase their demand for oxygen, hence active regions will have a stronger PET signal.
PET scanners are capable of resolving metabolic activity to regions, or voxels, of approximately 5 to 10 mm3. Although this volume includes thousands of neurons, it is sufficient to identify cortical and subcortical areas of enhanced activity. It can even show functional variation within a given cortical area, as the images in Figure 3.30 demonstrate.
PiB: A Recent Addition to the PET Tracer Family Recognizing that PET scanners can measure any radioactive agent, researchers have sought to develop specialized molecules that might serve as biomarkers of particular neurological disorders and pathologies. One important result has been the synthesis of PiB, or Pittsburgh Compound B, a radioactive agent developed by Chester Mathis and William Klunk at the University of Pittsburgh when they were looking for new ways to diagnosis and monitor Alzheimer’s disease. Historically, Alzheimer’s has been a clinical diagnosis (and frequently misdiagnosed), because a definitive diagnosis required sectioning brain tissue postmortem to identify the characteristic beta-amyloid plaques and neurofibrillary tangles. A leading hypothesis for the cause of Alzheimer’s disease is that the production of amyloid, a ubiquitous protein in tissue, goes awry and leads to the characteristic plaques. Beta-amyloid plaques in particular appear to be a hallmark of Alzheimer’s disease. Mathis and Klunk set out to find a radioactive compound that would specifically label beta-amyloid. After testing hundreds of compounds, they identified PiB, a protein-specific, carbon11-labeled dye that could be used as a PET tracer (Klunk et al., 2004). PiB binds to beta-amyloid (Figure 3.31), providing physicians with an in vivo assay of the presence of this biomarker. PET scans can now be used to measure beta-amyloid plaques, thus adding a new tool for diagnosing Alzheimer’s. What’s more, it can be used to screen people showing very early stages of cognitive impairment, or even people who are asymptomatic, to predict the likelihood of developing Alzheimer’s. Being able to diagnose the disease definitively is a boon to patient treatment—because of the previously substantial risk of misdiagnosis—and to research, as scientists develop new experimental drugs designed either to disrupt the pathological development of plaques or to treat the symptoms of Alzheimer’s.

FIGURE 3.30 Measurements of cerebral blood flow using PET to identify brain areas involved in visual perception.
(a) Baseline condition: Blood flow when the participant fixated on a central cross. Activity in this baseline condition was subtracted from that in the other conditions in which the participant views a checkerboard surrounding the fixation cross to help participants from moving their eyes. The stimulus is presented at varying positions, ranging from near the center of vision to the periphery (b–d). A retinotopic map can be identified in which central vision is represented more inferiorly than peripheral vision. Areas that were more active when the participant was viewing the checkerboard stimulus will have higher counts, reflecting increased blood flow. This subtractive procedure ignores variations in absolute blood flow between the brain’s areas. The difference image identifies areas that show changes in metabolic activity as a function of the experimental manipulation.
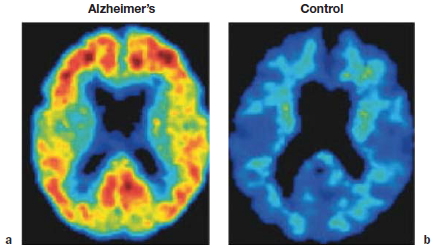
FIGURE 3.31 Using PiB to look for signs of Alzheimer’s disease.
PiB is a PET dye that binds to beta-amyloid. The dye was injected into a man with moderate symptoms of Alzheimer’s disease (a) and into a cognitively-normal woman (b) of similar age. (a) The patient with Alzheimer’s disease shows significant binding of PiB in the frontal, posterior cingulate, parietal, and temporal cortices, as evidenced by the red, orange, and yellow. (b) The control participant shows no uptake of PiB in her brain.
Functional Magnetic Resonance Imaging
As with PET, functional magnetic resonance imaging (fMRI) exploits the fact that local blood flow increases in active parts of the brain. The procedure is essentially identical to the one used in traditional MRI. Radio waves cause the protons in hydrogen atoms to oscillate, and a detector measures local energy fields that are emitted as the protons return to the orientation of the magnetic field created by the MRI machine. With fMRI, however, imaging is focused on the magnetic properties of the deoxygenated form of hemoglobin, deoxyhemoglobin. Deoxygenated hemoglobin is paramagnetic (i.e., weakly magnetic in the presence of a magnetic field), whereas oxygenated hemoglobin is not. The fMRI detectors measure the ratio of oxygenated to deoxygenated hemoglobin; this value is referred to as the blood oxygen level–dependent, or BOLD, effect.
Intuitively, it might be expected that the proportion of deoxygenated hemoglobin will be greater in the area surrounding active brain tissue, given the intensive metabolic costs associated with neural function. fMRI results, however, are generally reported as an increase in the ratio of oxygenated to deoxygenated hemoglobin. This change occurs because, as a region of the brain becomes active, the amount of blood being directed to that area increases. The neural tissue is unable to absorb all of the excess oxygen. Functional MRI studies measure the time course of this process. Although neural events occur on a timescale measured in milliseconds, changes in blood flow are modulated much more slowly. In Figure 3.32, note that following the presentation of a stimulus (in this case, a visual stimulus), an increase in the BOLD response is observed after a few seconds, peaking 6 to 10 seconds later. Thus, fMRI can be used to obtain an indirect measure of neuronal activity by measuring changes in blood flow.

FIGURE 3.32 Functional MRI signal observed from visual cortex in the cat with a 4.7-tesla scanner.
The black bar indicates the duration of a visual stimulus. Initially there is a dip in the blood oxygen level–dependent (BOLD) signal, reflecting the depletion of oxygen from the activated cells. Over time, the BOLD signal increases, reflecting the increased hemodynamic response to the activated area. Scanners of this strength are now being used with human participants.
Functional MRI has led to revolutionary changes in cognitive neuroscience. Just over 20 years from when the first neuroimaging study appeared in the early 1990s, fMRI papers now fill the pages of neuroscience journals. Functional MRI offers several advantages over PET. MRI scanners are much less expensive and easier to maintain; fMRI uses no radioactive tracers, so it does not incur the additional costs, hassles, and hazards associated with handling these materials. Because fMRI does not require the injection of radioactive tracers, the same individual can be tested repeatedly, either in a single session or over multiple sessions. Thus, it becomes possible to perform a complete statistical analysis on the data from a single participant. In addition, the spatial resolution of fMRI is superior to PET, in part because high-resolution anatomical images are obtained (using traditional MRI) while the participant is in the scanner.
Block Design Versus Event-Related Design Experiments Functional MRI and PET differ in their temporal resolution, which has ramifications for study designs. PET imaging requires sufficient time to detect enough radiation to create images of adequate quality. The participant must be engaged continually in a single given experimental task for at least 40 s, and metabolic activity is averaged over this interval. Because of this time requirement, block design experiments must be used with PET. In a block design experiment, the recorded neural activity is integrated over a “block” of time during which the participant either is presented a stimulus or performs a task. The recorded activity pattern is then compared to other blocks that have been recorded while doing the same task or stimulus, a different task or stimulus, or nothing at all. Because of the extended time requirement, the specificity of correlating activation patterns with a specific cognitive process suffers.
Functional MRI studies frequently use either a block design, in which neuronal activation is compared between experimental and control scanning phases (Figure 3.33), or an event-related design. Similar to what we saw before in ERP studies, the term event-related refers to the fact that, across experimental trials, the BOLD response will be linked to specific events such as the presentation of a stimulus or the onset of a movement. Although metabolic changes to any single event are likely to be hard to detect among background fluctuations in the brain’s hemodynamic response, a clear signal can be obtained by averaging over repetitions of these events. Event-related fMRI improves the experimental design because experimental and control trials can be presented randomly. Researchers using this approach can be more confident that the participants are in a similar attentional state during both types of trials, which increases the likelihood that the observed differences reflect the hypothesized processing demands rather than more generic factors, such as a change in overall arousal. Although a block design experiment is better able to detect small effects, researchers can use a greater range of experimental setups with event-related design; indeed, some questions can be studied only by using event-related fMRI (Figure 3.34).
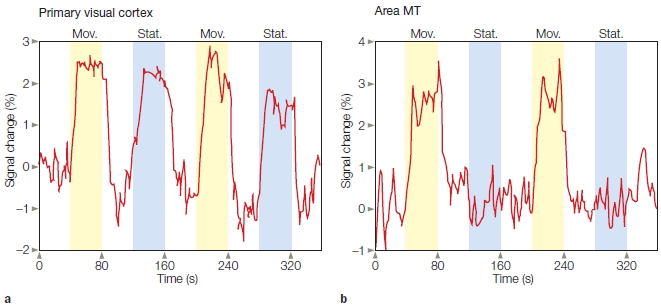
FIGURE 3.33 Functional MRI measures time-dependent fluctuations in oxygenation with good spatial resolution.
The participant in this experiment viewed a field of randomly positioned white dots on a black background. The dots would either remain stationary or move along the radial axis. The 40-s intervals of stimulation (shaded background) alternated with 40-s intervals during which the screen was blank (white background). (a) Measurements from primary visual cortex (V1) showed consistent increases during the stimulation intervals compared to the blank intervals. (b) In area MT, a visual region associated with motion perception (see Chapter 5), the increase was observed only when the dots were moving.
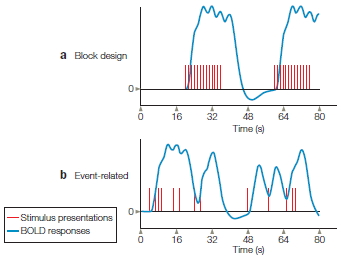
FIGURE 3.34 Block design versus event-related design.
A powerful feature of event-related fMRI is that the experimenter can choose to combine the data in many different ways after scanning is completed. For example, consider memory failure. Most of us have experienced the frustration of being introduced to someone at a party and then being unable to remember the person’s name just 2 minutes later. Is this because we failed to listen carefully during the original introduction, so the information never really entered memory? Or did the information enter our memory stores but, after 2 minutes of distraction, we were unable to access the information? The former would constitute a problem with memory encoding; the latter would reflect a problem with memory retrieval. Distinguishing between these two possibilities has been difficult, as evidenced by the thousands of articles on this topic that have appeared in cognitive psychology journals over the past 100 years.
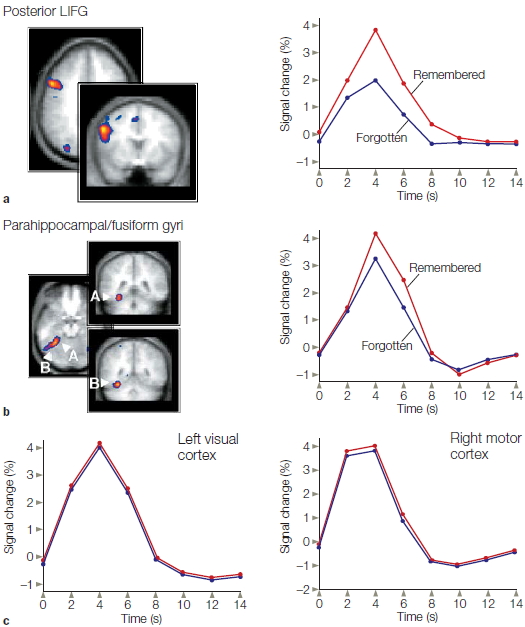
FIGURE 3.35 Event-related fMRI study showing memory failure as a problem of encoding.
Both the left inferior frontal gyrus (LIFG) (a) and the parahippocampal region (b) in the left hemisphere exhibit greater activity during encoding for words that are subsequently remembered compared to those that are forgotten. (A = parahippocampal region; B = fusiform gyrus.) (c) Activity over the left visual cortex and right motor cortex is identical following words that subsequently are either remembered or forgotten. These results demonstrate that the memory effect is specific to the frontal and hippocampal regions.
Anthony Wagner and his colleagues at Harvard University used event-related fMRI to take a fresh look at the question of memory encoding versus retrieval (Wagner et al., 1998). They obtained fMRI scans while participants were studying a list of words, where one word appeared every 2 seconds. About 20 minutes after completing the scanning session, the participants were given a recognition memory test. On average, the participants correctly recognized 88 % of the words studied during the scanning session. The researchers then separated the trials on the basis of whether a word had been remembered or forgotten. If the memory failure was due to retrieval difficulties, no differences should be detected in the fMRI response to these two trials, since the scans were obtained only while the participants were reading the words. If the memory failure was due to poor encoding, however, the researchers would expect to see a different fMRI pattern following presentation of the words that were later remembered compared to those that were forgotten. The results clearly favored the encoding-failure hypothesis (Figure 3.35). The BOLD signal recorded from two areas, the prefrontal cortex and the hippocampus, was stronger following the presentation of words that were later remembered. (As we’ll see in Chapter 9, these two areas of the brain play a critical role in memory formation.) The block design method could not be used in a study like this, because the signal is averaged over all of the events within each scanning phase.
Limitations of PET and fMRI
It is important to understand the limitations of imaging techniques such as PET and fMRI. First, PET and fMRI have poor temporal resolution compared with single-cell recordings or ERPs. PET is constrained by the decay rate of the radioactive agent (on the order of minutes), and fMRI is dependent on the hemodynamic changes (on the order of seconds) that underlie the BOLD response. A complete picture of the physiology and anatomy of cognition usually requires integrating results obtained in ERP studies with those obtained in fMRI studies.
A second difficulty arises when interpreting the data from a PET or fMRI study. The data sets from an imaging study are massive, and often the comparison of experimental and control conditions produces many differences. This should be no surprise, given what we know about the distributed nature of brain function. For example, asking someone to generate a verb associated with a noun (experimental task) likely requires many more cognitive operations than just saying the noun (control task). As such, it is difficult to make inferences about each area’s functional contribution from neuroimaging data. Correlation does not imply causation. For example, an area may be activated during a task but not play a critical role in performance of the task. The BOLD signal is primarily driven by neuronal input rather than output (Logothetis et al., 2001); as such, an area showing increased activation may be downstream from brain areas that provide the critical computations. Rather than focus on local changes in activity, the data from an fMRI study can be used to ask whether the activation changes in one brain area are correlated with activation changes in another brain area—that is, to look at what is called functional connectivity (Sun et al., 2004). In this manner, fMRI data can be used to describe networks associated with particular cognitive operations and the relationships among nodes within those networks. This process is discussed next.
TAKE-HOME MESSAGES
- Positron emission tomography (PET) measures metabolic activity in the brain by monitoring the distribution of a radioactive tracer. The PET scanner measures the photons that are produced during decay of the tracer. A popular tracer is 15O because it decays rapidly and the distribution of oxygen increases to neural regions that are active.
- Pittsburgh Compound B (PiB) is a tracer that binds to beta-amyloid and is used as an in vivo assay of the presence of this biomarker for Alzheimer’s disease.
- Functional magnetic resonance imaging (fMRI) uses MRI to measure changes in the oxygen content of the blood (hemodynamic response). These changes are assumed to be correlated with local changes in neuronal activity.
Brain Graphs
Whether counting neurons or measuring physiological and metabolic activity, it is clear that the brain is made up of networks of overwhelmingly complicated connections. Just as a picture is worth a thousand words, a graph helps illuminate the complex communication systems in the brain. Graphs are a tool for understanding connections and patterns of information flow. Methods originally developed in computer science to study problems like air traffic communication are now being adopted by neuroscientists to develop brain graphs. A brain graph is a visual model of the connections within some part of the nervous system. The model is made up of nodes, which are the neural elements, and edges, which are the connections between neural elements. The geometric relationships of the nodes and edges define the graph and provide a visualization of brain organization.
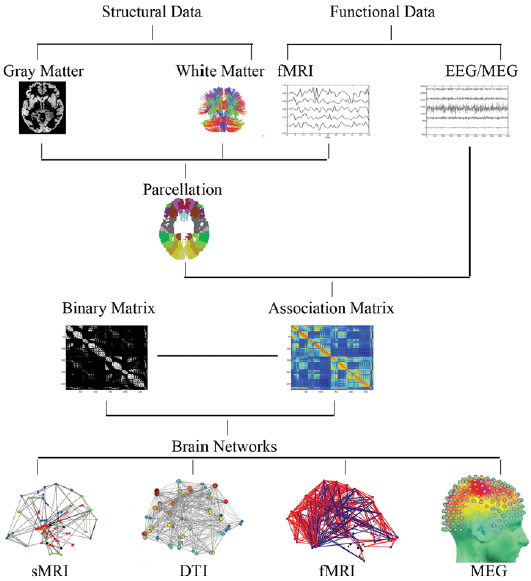
FIGURE 3.36 Constructing a human brain network.
A brain network can be constructed with either structural or functional imaging data. The data imaging methods such as anatomical MRI or fMRI can be divided into regions of interest. This step would already be performed by the sensors in EEG and MEG studies. Links between the regions of interest can then be calculated, using measures like DTI strength or functional connectivity. From these data, brain networks can be constructed.
Neuroscientists can construct brain graphs by using the data obtained from just about any neuroimaging method (Figure 3.36). The selected data set will dictate what constitutes the nodes and edges. For instance, the nematode worm, Caenorhabditis elegans, is the only organism for which the entire network of cellular connections have been completely described. Because of its very limited nervous system, a brain graph can be constructed in which each node is a neuron. On the scale of the human brain, however, with its millions of neurons, the nodes and edges represent anatomically or functionally defined units. For instance, the nodes might be clusters of voxels and the edges a representation of nodes that show correlated patterns of activation. In this manner, researchers can differentiate between nodes that act as hubs, sharing links with many neighboring nodes, and nodes that act as connectors, providing links to more distant clusters. Beyond simply showing the edges, a brain graph can also depict the relative strength, or weighting, of the edges.
Brain graphs are a valuable way to compare results from experiments using different methods (Bullmore & Bassett, 2011). For instance, graphs based on anatomical measures such as diffusion tensor imaging (DTI) can be compared with graphs based on functional measures such as fMRI. Brain graphs also provide ways to visualize the organizational properties of neural networks. For instance, three studies employing vastly different data sets to produce graphical models have reported similar associations between general intelligence and topological measures of brain network efficiency (van den Heuvel et al., 2009; Bassett et al., 2009; Li et al. 2009).
Brain graphs promise to provide a new perspective on neurological and psychiatric disorders. The neurological problems observed in patients with traumatic brain injury (TBI) likely reflect problems in connectivity, rather than restricted damage to specific brain regions. Even when the pathology is relatively restricted, as in stroke, the network properties of the brain are likely disrupted (Catani & ffytche, 2005). Brain graphs can be used to reveal these changes, providing a bird’s-eye view of the damaged landscape.
TAKE-HOME MESSAGES
- A brain graph is a visual model of brain organization, and can be defined either with structural or functional data. Because it can be constructed from data obtained through different types of neuroimaging methods, a brain graph is a valuable way to compare results from experiments using different methods.
Computer Modeling
Creating computer models to simulate postulated brain processes is a research method that complements the other methods discussed in this chapter. A simulation is an imitation, a reproduction of behavior in an alternative medium. The simulated cognitive processes are commonly referred to as artificial intelligence—artificial in the sense that they are artifacts, human creations—and intelligent in that the computers perform complex functions. The simulations are designed to mimic behavior and the cognitive processes supporting that behavior. The computer is given input and then must perform internal operations to create a behavior. By observing the behavior, the researcher can assess how well it matches behavior produced by a real mind. Of course, to get the computer to succeed, the modeler must specify how information is represented and transformed within the program. To do this, he or she must generate concrete hypotheses regarding the “mental” operations needed for the machine. As such, computer simulations provide a useful tool for testing theories of cognition. The success and failure of various models yields valuable insight into the strengths and weaknesses of a theory.
In general, brains all have the same components; but just like fingerprints, no two brains are exactly the same. Brains vary in overall size, in the size and location of gyri, in the size of individual regions, in shape, and in connectivity. As a result, each brain has a unique configuration, and each person solves problems in different ways. This variation presents a problem when trying to compare the structures and functions of one brain with another.
One solution is to use mathematical methods to align individual brain images into a common space, building on the assumption that points deep in the cerebral hemispheres have a predictable relationship to the horizontal planes running through the anterior and posterior commissures, two large white matter tracts connecting the two cerebral hemispheres. In 1988, Jean Talairach and Pierre Tournoux published a standardized, three-dimensional, proportional grid system to identify and measure brain components despite their variability (Talairach & Tournoux, 1988). Using the postmortem brain of a 60-year-old French woman, they divided the brain into thousands of small, volume-based units, known as voxels (think of tiny cubes). Each voxel was given a 3-D Talairach coordinate in relation to the anterior commissure, on the x (left or right), y (anterior or posterior), and z (superior or inferior) axes. By using these standard anatomical landmarks, researchers can take individual brain images obtained from MRI and PET scans, and morph them onto standard Talairach space as a way to combine information across individuals.
There are limitations to this method, however. To fit brains to the standardized atlas, the images must be warped to fit the standard template. The process also requires smoothing, a method that is somewhat equivalent to blurring the image. Smoothing helps compensate for the imperfect alignment, but it can also give a misleading picture of the extent of activation changes among the voxels. The next step in data analysis is a statistical comparison of activation of the thousands of voxels between baseline and experimental conditions. Choosing the proper significance threshold is important. Too high, and you may miss regions that are significant; too low, and you risk including random activations. Functional imaging studies frequently use what is termed “corrected” significance levels, implying that the statistical criteria have been adjusted to account for the many comparisons involved in the analysis.

FIGURE 3.37 Behavioral differences due to different circuitry.
Two very simple vehicles, each equipped with two sensors that excite motors on the rear wheels. The wheel linked to the sensor closest to the sun will turn faster than the other wheel, thus causing the vehicle to turn. Simply changing the wiring scheme from uncrossed to crossed radically alters the behavior of the vehicles. The “coward” will always avoid the source, whereas the “aggressor” will relentlessly pursue it.
Computer models are useful because they can be analyzed in detail. In creating a simulation, however, the researcher must specify explicitly how the computer is to represent and process information. This does not mean that a computer’s operation is always completely predictable and that the outcome of a simulation is known in advance. Computer simulations can incorporate random events or be on such a large scale that analytic tools do not reveal the solution. The internal operations, the way information is computed, however, must be known. Computer simulations are especially helpful to cognitive neuroscientists in recognizing problems that the brain must solve to produce coherent behavior.
Braitenberg (1984) provided elegant examples of how modeling brings insight to information processing. Imagine observing the two creatures shown in Figure 3.37 as they move about a minimalist world consisting of a single heat source, such as a sun. From the outside, the creatures look identical: They both have two sensors and four wheels. Despite this similarity, their behavior is distinct: One creature moves away from the sun, and the other homes in on it. Why the difference? As outsiders with no access to the internal operations of these creatures, we might conjecture that they have had different experiences and so the same input activates different representations. Perhaps one was burned at an early age and fears the sun, and maybe the other likes the warmth.
As their internal wiring reveals, however, the behavioral differences depend on how the creatures are wired. The uncrossed connections make the creature on the left turn away from the sun; the crossed connections force the creature on the right to orient toward it. Thus, the two creatures’ behavioral differences arise from a slight variation in how sensory information is mapped onto motor processes.
These creatures are exceedingly simple—and inflexible in their actions. At best, they offer only the crudest model of how an invertebrate might move in response to a phototropic sensor. The point of Braitenberg’s example is not to model a behavior; rather, it represents how a single computational change—from crossed to uncrossed wiring—can yield a major behavioral change. When interpreting such a behavioral difference, we might postulate extensive internal operations and representations. When we look inside Braitenberg’s models, however, we see that there is no difference in how the two models process information, but only a difference in their patterns of connectivity (see the preceding section, on Brain Graphs).
Representations in Computer Models
Computer models differ widely in their representations. Symbolic models include, as we might expect, units that represent symbolic entities. A model for object recognition might have units that represent visual features like corners or volumetric shapes. An alternative architecture that figures prominently in cognitive neuroscience is the neural network. In neural networks, processing is distributed over units whose inputs and outputs represent specific features. For example, they may indicate whether a stimulus contains a visual feature, such as a vertical or a horizontal line.
Models can be powerful tools for solving complex problems. Simulations cover the gamut of cognitive processes, including perception, memory, language, and motor control. One of the most appealing aspects of neural networks is that the architecture resembles the nervous system, at least superficially. In these models, processing is distributed across many units, similar to the way that neural structures depend on the activity of many neurons. The contribution of any unit may be small in relation to the system’s total output, but complex behaviors can be generated by the aggregate action of all the units. In addition, the computations in these models are simulated to occur in parallel. The activation levels of the units in the network can be updated in a relatively continuous and simultaneous manner.
Computational models can vary widely in the level of explanation they seek to provide. Some models simulate behavior at the systems level, seeking to show how cognitive operations such as motion perception or skilled movements can be generated from a network of interconnected processing units. In other cases, the simulations operate at a cellular or even molecular level. For example, neural network models have been used to investigate how variation in transmitter uptake is a function of dendrite geometry (Volfovsky et al., 1999). The amount of detail that must be incorporated into the model is dictated largely by the type of question being investigated. Many problems are difficult to evaluate without simulations, either experimentally because the available experimental methods are insufficient, or mathematically because the solutions become too complicated given the many interactions of the processing elements.
An appealing aspect of neural network models, especially for people interested in cognitive neuroscience, is that “lesion” techniques demonstrate how a model’s performance changes when its parts are altered. Unlike strictly serial computer models that collapse if a circuit is broken, neural network models degrade gracefully: The model may continue to perform appropriately after some units are removed, because each unit plays only a small part in the processing. Artificial lesioning is thus a fascinating way to test a model’s validity. Initially, a model is constructed to see if it adequately simulates normal behavior. Then “lesions” can be included to see if the breakdown in the model’s performance resembles the behavioral deficits observed in neurological patients.
Models Lead to Testable Predictions
The contribution of computer modeling usually goes beyond assessing whether a model succeeds in mimicking a cognitive process. Models can generate novel predictions that can be tested with real brains. An example of the predictive power of computer modeling comes from the work of Szabolcs Kali of the Hungarian Academy of Sciences and Peter Dayan at the University College London (Kali & Dayan, 2004). Their computer models were designed to ask questions about how people store and retrieve information in memory about specific events—what is called episodic memory (see Chapter 9). Observations from the neurosciences suggest that the formation of episodic memories depends critically on the hippocampus and adjacent areas of the medial temporal lobe, whereas the storage of such memories involves the neocortex. Kali and Dayan used a computer model to explore a specific question: How is access to stored memories maintained in a system where the neocortical connections are ever changing (see the discussion on cortical plasticity in Chapter 2)? Does the maintenance of memories over time require the reactivation of hippocampal–neocortical connections, or can neocortical representations remain stable despite fluctuations and modifications over time?
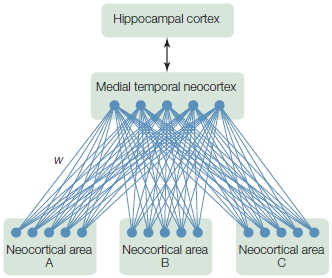
FIGURE 3.38 Computational model of episodic memory.
“Neurons” (●) in neocortical areas A, B, and C are connected in a bidirectional manner to “neurons” in the medial temporal neocortex, which is itself connected bidirectionally to the hippocampus. Areas A, B, and C represent highly processed inputs (e.g., inputs from visual, auditory, or tactile domains). As the model learns, it extracts categories, trends, and correlations from the statistics of the inputs (or patterns of activations) and converts these to weights (w) that correspond to the strengths of the connections. Before learning, the weights might be equal or set to random values. With learning, the weights become adjusted to reflect correlations between the processing units.
The model architecture was based on anatomical facts regarding patterns of connectivity between the hippocampus and neocortex (Figure 3.38). The model was then trained on a set of patterns that represented distinct episodic memories. For example, one pattern of activation might correspond to the first time you visited the Pacific Ocean; another pattern, to the lecture in which you first learned about the Stroop effect. Once the model had mastered the memory set by showing that it could correctly recall a full episode when given only partial information, Kali and Dayan tested it on a consolidation task. Could old memories remain after the hippocampus was disconnected from the cortex if cortical units continued to follow their initial learning rules? In essence, this was a test of whether lesions to the hippocampus would disrupt long-term episodic memory. The results indicated that episodic memory became quite impaired when the hippocampus and cortex were disconnected. Thus the model predicts that hippocampal reactivation is necessary for maintaining even well-consolidated episodic memories. In the model, this maintenance process requires a mechanism that keeps hippocampal and neocortical representations in register with one another, even as the neocortex undergoes subtle changes associated with daily learning.
This modeling project was initiated because research on people with lesions of the hippocampus had failed to provide a clear answer about the role of this structure in memory consolidation. The model, based on known principles of neuroanatomy and neurophysiology, could be used to test specific hypotheses concerning one type of memory, episodic memory, and to direct future research. Of course, the goal here is not to make a model that has perfect memory consolidation. Rather, it is to ask how human memory works.
The contribution of computer simulations continues to grow in the cognitive neurosciences. The trend in the field is for modeling work to be more constrained by neuroscience. Researchers will replace generic processing units with elements that embody the biophysics of the brain. In a reciprocal manner, computer simulations provide a useful way to develop theory, which may then aid researchers in designing experiments and interpreting results.
TAKE-HOME MESSAGES
- Computer models are used to simulate neural networks in order to ask questions about cognitive processes and generate predictions that can be tested in future research.
Converging Methods
As we’ve seen throughout these early chapters, cognitive neuroscience is an interdisciplinary field that draws on ideas and methodologies from cognitive psychology, neurology, the neurosciences, and computer science. Optogenetics is a prime example of how the paradigms and methods from different disciplines have coalesced into a startling new methodology for cognitive neuroscientists and, perhaps soon, for clinicians. The great strength of cognitive neuroscience lies in how diverse methodologies are integrated.
Many examples of convergent methods will be evident as you make your way through this book. For example, the interpretation of results from neuroimaging studies is frequently guided by other methodologies. Single-cell recording studies of primates can be used to identify regions of interest in an fMRI study of humans. Imaging studies can be used to isolate a component operation that might be linked to a particular brain region based on the performance of patients with injuries to that area.
In turn, imaging studies can be used to generate hypotheses that are tested with alternative methodologies. A striking example of this method comes from work asking how people identify objects through touch. An fMRI study on this problem revealed an unexpected result: tactile object recognition led to pronounced activation of the visual cortex, even though the participants’ eyes were shut during the entire experiment (Deibert et al., 1999; Figure 3.39a). One possible reason for visual cortex activation is that the participants identified the objects through touch and then generated visual images of them. Alternatively, the participants might have constructed visual images during tactile exploration and then used the images to identify the objects.
A follow-up study with transcranial magnetic stimulation (TMS) was used to pit these hypotheses against one another (Zangaladze et al., 1999). TMS stimulation over the visual cortex impaired tactile object recognition. The disruption was observed only when the TMS pulses were delivered 180 ms after the hand touched the object; no effects were seen with earlier or later stimulation (Figure 3.39b). The results indicate that the visual representations generated during tactile exploration were essential for inferring object shape from touch. These studies demonstrate how the combination of fMRI and TMS allows investigators to test causal accounts of neural function as well as make inferences about the time course of processing. Obtaining converging evidence from various methodologies enables neuroscientists to make the strongest conclusions possible.
One of the most promising methodological developments in cognitive neuroscience is the combined use of imaging, behavioral, and genetic methods. This approach is widely employed in studies of psychiatric conditions known to have a genetic basis. Daniel Weinberger and his colleagues at the National Institutes of Health have proposed that the efficacy of antipsychotic medications in treating schizophrenia varies as a function of how a particular gene is expressed, or what is called a polymorphism (Bertolino et al., 2004; Weickert et al., 2004). In particular, when given an antipsychotic drug, schizophrenics, who have one variant of a gene linked to the release of dopamine in prefrontal cortex, show improved performance on tasks requiring working memory and correlated changes in prefrontal activity. In contrast, schizophrenics with a different variant of the gene did not respond to the drugs.
The logic underlying these clinical studies can also be applied to ask how genetic differences within the normal population relate to individual variations in brain function and behavior. A common polymorphism in the human brain is related to the gene that codes for monoamine oxidase A (MAOA). Using a large sample of healthy individuals, Weinberger’s group found that the low-expression variant was associated with increased tendency toward violent behavior as well as hyperactivation of the amygdala when the participants viewed emotionally arousing stimuli (Meyer-Lindenberg et al., 2006). Similarly, variation in dopamine-related genes (COMT and DRD4) have been related to differences in risk taking and conflict resolution: Does an individual stick out her neck to explore? How well can an individual make a decision when faced with multiple choices? Phenotypic differences correlate with the degree of activation in the anterior cingulate, a region associated with the conflict that arises when having to make such choices (Figure 3.40; for a review, see Frank & Fosella, 2011).

FIGURE 3.39 Combined use of fMRI and TMS to demonstrate the role of the visual cortex in tactile perception.
(a) Functional MRI showing areas of activation in nine people during tactile exploration with the eyes closed. All of the participants show some activation in striate and extrastriate cortex. (b) Accuracy in judging orientation of tactile stimulus that is vibrated against the right index finger. Performance is disrupted when the pulse is applied 180 ms after stimulus onset, but only when the coil is positioned over the left occipital lobe or at a midline point, between the left and right sides of the occipital lobe.
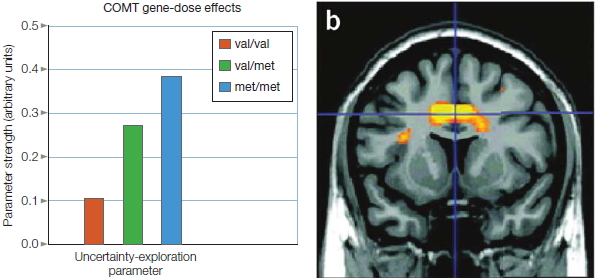
FIGURE 3.40 Genetic effects on decision making.
(a) Participants were divided into three groups based on a genetic analysis of the COMT gene. They performed a decision-making task and a model was used to estimate how likely they were to explore new, but uncertain choices. Those with the met/met allele were more likely to explore compared to those with the val/val allele. (b) Allele differences in the DRD4 gene influenced the level of conflict-related activity in the anterior cingulate cortex (region highlighted in yellow-orange).
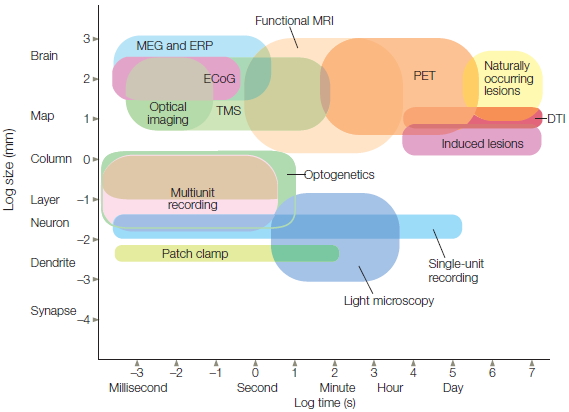
FIGURE 3.41 Spatial and temporal resolution of the prominent methods used in cognitive neuroscience.
Temporal sensitivity, plotted on the x-axis, refers to the timescale over which a particular measurement is obtained. It can range from the millisecond activity of single cells to the behavioral changes observed over years in patients who have had strokes. Spatial sensitivity, plotted on the y-axis, refers to the localization capability of the methods. For example, real-time changes in the membrane potential of isolated dendritic regions can be detected with the patch clamp method, providing excellent temporal and spatial resolution. In contrast, naturally occurring lesions damage large regions of the cortex and are detectable with MRI.
TAKE-HOME MESSAGES
- Powerful insights into the structural and functional underpinnings of cognitive behavior can be gained from experiments that combine methods such as genetic, behavioral, and neuroimaging techniques.
Summary
Two goals have guided our overview of cognitive neuroscience methods presented in this chapter. The first was to provide a sense of how various methodologies have come together to form the interdisciplinary field of cognitive neuroscience (Figure 3.41). Practitioners of the neurosciences, cognitive psychology, and neurology differ in the tools they use—and also, often, in the questions they seek to answer. The neurologist may request a CT scan of an aging boxer to determine if the patient’s confusional state is reflected in atrophy of the frontal lobes. The neuroscientist may want a blood sample from the patient to search for metabolic markers indicating a reduction in a transmitter system. The cognitive psychologist may design a reaction time experiment to test whether a component of a decision-making model is selectively impaired. Cognitive neuroscience endeavors to answer all of these questions by taking advantage of the insights that each approach has to offer and using them together.
The second goal of this chapter was to introduce methods that we will encounter in subsequent chapters. These chapters focus on content domains such as perception, language, and memory, and on how these tools are being applied to understand the brain and behavior. Each chapter draws on research that uses the diverse methods of cognitive neuroscience. The convergence of results obtained by using different methodologies frequently offers the most complete theories. A single method often cannot bring about a complete understanding of the complex processes of cognition.
We have reviewed many methods, but the review is incomplete. Other methods include patch clamp techniques to isolate restricted regions on the neuron, enabling studies of the membrane changes that underlie the flow of neurotransmitters, and laser surgery can be used to restrict lesions to just a few neurons in simple organisms, providing a means to study specific neural interactions. New methodologies for investigating the relation of the brain and behavior spring to life each year. Neuroscientists are continually refining techniques for measuring and manipulating neural processes at a finer and finer level. Genetic techniques such as knockout procedures have exploded in the past decade, promising to reveal the mechanisms involved in many normal and pathological brain functions. Optogenetics, which uses light to control the activity of neurons and hence to control neural activity and even behavior, has given researchers a new level of control to probe the nervous system.
Technological change is also a driving force in our understanding of the human mind. Our current imaging tools are constantly being refined. Each year, more sensitive equipment is developed to measure the electrophysiological signals of the brain or the metabolic correlates of neural activity, and the mathematical tools for analyzing these data are constantly becoming more sophisticated. In addition, entire new classes of imaging techniques are beginning to gain prominence.
We began this chapter by pointing out that paradigmatic changes in science are often fueled by technological developments. In a symbiotic way, the maturation of a scientific field such as cognitive neuroscience provides a tremendous impetus for the development of new methods. Obtaining answers to the questions neuroscientists ask is often constrained by the tools available, but such questions promote the development of new research tools. It would be naïve to imagine that current methodologies will become the status quo for the field. We can anticipate the development of new technologies, making this an exciting time to study the brain and behavior.
Key Terms
angiography (p. 79)
block design experiment (p. 108)
blood oxygen level–dependent (BOLD) (p. 107)
brain graph (p. 110)
brain lesion (p. 79)
cerebral vascular accident (79) cognitive psychology (p. 74)
computed tomography (CT, CAT) (p. 91)
deep-brain stimulation (DBS) (p. 86)
degenerative disorder (p. 80)
diffusion tensor imaging (DTI) (p. 93)
double dissociation (p. 84)
electrocortogram (ECoG) (p. 102)
electroencephalography (EEG) (p. 99)
event-related design (p. 108)
event-related potential (ERP) (p. 100)
functional magnetic resonance imaging (fMRI) (p. 105)
knockout procedure (p. 90)
magnetic resonance imaging (MRI) (p. 92)
magnetoencephalography (MEG) (p. 102)
multiunit recording (p. 97)
neural network (p. 113)
neurophysiology (p. 95)
optogenetics (p. 72)
pharmacological studies (p. 87)
PiB (p. 106)
positron emission tomography (PET) (p. 105)
receptive field (p. 96)
regional cerebral blood flow (rCBF) (p. 106)
retinotopic (p. 97)
simulation (p. 111)
single dissociation (p. 84)
single-cell recording (p. 95)
smoothing (p. 112)
Talairach coordinate (p. 112)
time-frequency analysis (p. 102)
transcanial direct current stimulation (tDCS) (p. 89)
transcranial magnetic stimulation (TMS) (p. 88)
traumatic brain injury (TBI) (p. 81)
voxel (p. 106)
Thought Questions
- To a large extent, progress in all scientific fields depends on the development of new technologies and methodologies. What technological and methodological developments have advanced the field of cognitive neuroscience?
- Cognitive neuroscience is an interdisciplinary field that incorporates aspects of neuroanatomy, neurophysiology, neurology, and cognitive psychology. What do you consider the core feature of each discipline that allows it to contribute to cognitive neuroscience? What are the limits of each discipline in addressing questions related to the brain and mind?
- In recent years, functional magnetic resonance imaging (fMRI) has taken the field of cognitive neuroscience by storm. The first studies with this method were reported in the early 1990s; now hundreds of papers are published each month. Provide at least three reasons why this method is so popular. Discuss some of the technical and inferential limitations associated with this method (inferential, meaning limitations in the kinds of questions the method can answer). Finally, propose an fMRI experiment you would conduct if you were interested in identifying the neural differences between people who like scary movies and those who don’t. Be sure to clearly state the different conditions of the experiment.
- Recently, it has been shown that people who performed poorly on spatial reasoning tasks have reduced volume in the parietal lobe. Discuss why caution is advised in assuming that the poor reasoning is caused by the smaller size of the parietal lobe. To provide a stronger test of causality, outline an experiment that involves a training program, describing your conditions, experimental manipulation, outcome measures, and predictions.
- Consider how you might study a problem such as color perception by using the multidisciplinary techniques of cognitive neuroscience. Predict the questions that you might ask about this topic, and outline the types of studies that cognitive psychologists, neurophysiologists, and neurologists might consider.
Suggested Reading
Chouinard, P. A., & Paus, T. (2010). What have we learned from “perturbing” the human cortical motor system with transcranial magnetic stimulation? Frontiers in Human Neuroscience, 4, Article 173.
Frank, M. J., & Fossella, J. A. (2011). Neurogenetics and pharmacology of learning, motivation and cognition. Neuropsychopharmacology, 36, 133–152.
Hillyard, S. A. (1993). Electrical and magnetic brain recordings: Contributions to cognitive neuroscience. Current Opinion in Neurobiology, 3, 710–717.
Huettel, S., Song, A. W., & McCarthy, G. (2004). Functional magnetic resonance imaging. Sunderland, MA: Sinauer.
Mori, S. (2007). Introduction to diffusion tensor imaging. New York: Elsevier.
Posner, M. I., & Raichle, M. E. (1994). Images of mind. New York: Freeman.
Rapp, B. (2001). The handbook of cognitive neuropsychology: What deficits reveal about the human mind. Philadelphia: Psychology Press.


